Security Leaders Need Reliable Success Metrics
Cybersecurity leaders play a critical role in safeguarding today’s organizations from risk. As the primary line of defense against cyberattacks, leaders and their teams are responsible for preventing catastrophic business outcomes – from operation shutdowns to sensitive data leaks, legal fallout, and more. The stakes are high for these leaders, and are only getting higher as they attempt to navigate a rapidly-shifting threat landscape, increasingly sophisticated adversaries, and a growing breadth of assets to protect.
Despite the critical nature of their work and the significant challenges they face, many security leaders aren’t getting the adequate financial and technological investment they need.
Bridging the Gap Between CISOs and the C-Suite
To greenlight significant investment, boards and other stakeholders usually need to see quantifiable metrics and demonstrable outcomes. They want to know: what tangible impact will an investment have on the business? Security leaders know the impact of their work is enormous, but they often struggle to procure the concrete proof boards want to see.
That’s because without the right frameworks and benchmarks in place, it’s difficult to pinpoint what success looks like for a security program, and even harder to validate. Even when security leaders can define success, they often struggle to translate what are typically complex, technical security metrics into business terms that resonate with board members, many of whom lack a deep understanding of cybersecurity.
In a recent survey of CISOs, the majority of respondents (58%) said they struggle to communicate technical language to senior leadership in a way that they can understand. Eighty-two percent of respondents also claimed that they feel pressure to make things sound better than they really are when in front of their board.
This disconnect undercuts security leaders’ ability to prove out business value and win buy-in for continued or expanded program investment. And without adequate investment, maintaining a security program that’s truly successful becomes even harder.
Enter: Censys trends and benchmark metrics.
Using Trends and Benchmarks to Communicate Impact
Censys’ trends and benchmarks metrics arm security leaders with the insights they need to understand their impact, communicate that impact to stakeholders, and take action to better align with business objectives. Censys’ Exposure Management trends and benchmarks define and demonstrate core metrics that communicate impact based on industry-standard cybersecurity themes. Security leaders can see how these metrics are calculated, access detailed supporting data, and benefit from flexibility in calculations to support business logic.
Specifically, with trends and benchmarks security leaders gain:
I. Out-of-the-box metrics that align to security program themes – Security leaders and their teams can leverage metrics that align to themes of Attack Surface Size and Composition, Risk Reduction, and Remediation. This gives them the opportunity to better focus the goals of their program and meaningfully measure progress. These metrics are oriented around executive reporting, so that they can be used in board conversations to communicate progress. In other words: they’re simple for folks outside of security to understand.
- Attack Surface Size: Leaders can use this metric to understand the total digital footprint exposed to threats, including all accessible assets and services, and learn more about if and how their attack surface is growing.
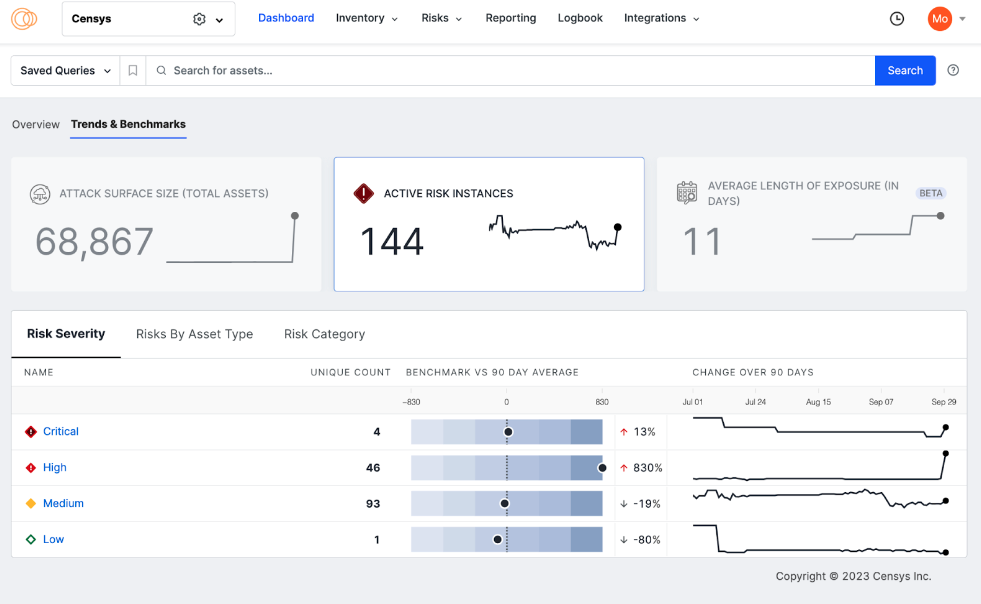
- Total Active Risks: Leaders can reference this metric to understand the total number of active risk instances that Censys observes within their attack surface. Active risks on assets that are exposed to the internet reflect a gap in the security perimeter.
- Average Length of Exposure for Risks: This measures the average number of days that Censys observed risks within an attack surface. The average length of exposure metric helps quantify how long an attacker might observe these risks and attempt to exploit them.
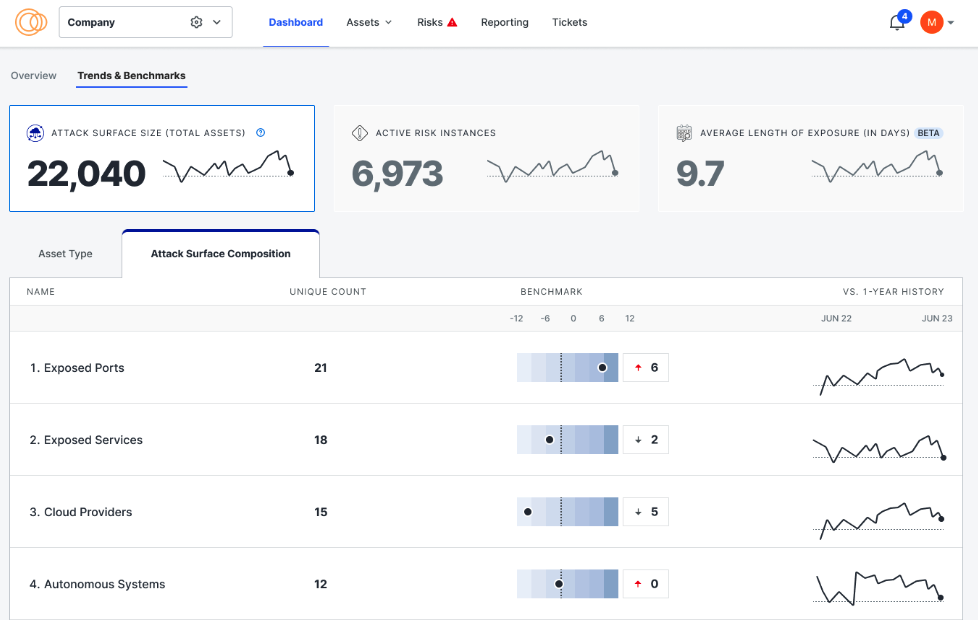
II. Drill-down capabilities that add context and insights – Leaders can drill down into a metric’s supporting segments to gain further context that can help explain and defend why a metric changed. These drill-down views provide insights that can inform strategy and give direction to practitioners. For example, when looking at Total Active Risks, leaders can drill down into a supporting segment to see the level or risk severity across active risks. They can answer questions like: How severe are the risks currently facing the organization? Are we seeing more critical risks than expected?
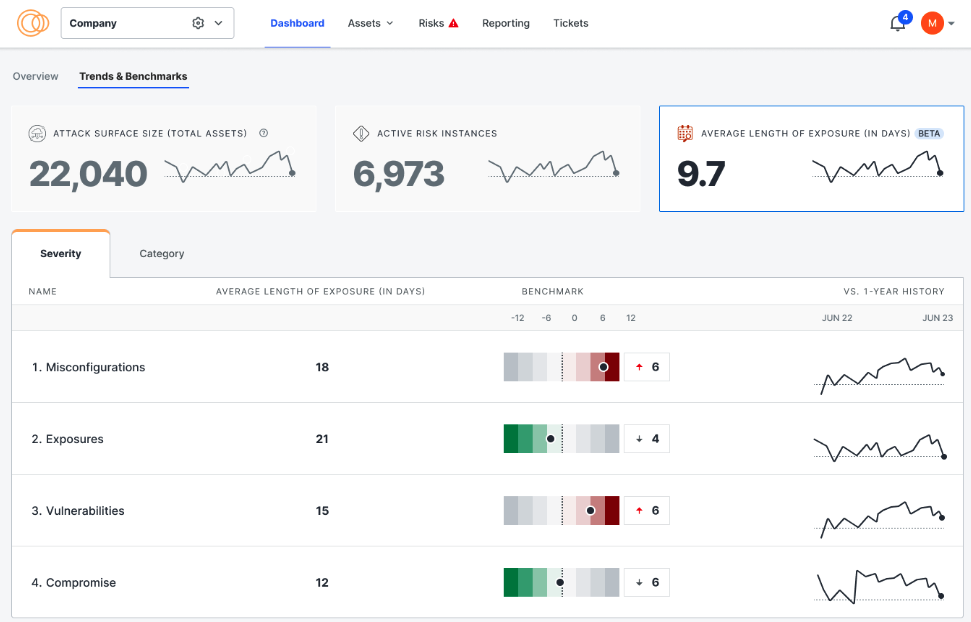
III. Historical trend analysis to demonstrate progress and justify a program – A historical trends view helps security leaders tell a story about how their team is progressing or regressing in their efforts to impact key metrics. These trends help teams communicate progress and justify the ways in which their Exposure Management solution has helped them achieve their goals. For example, a leader could use historical trend analysis to show how the team has significantly reduced the organization’s average length of risk exposure within the last quarter.
IV. Benchmarking – In trying to answer “what good looks like,” security leaders can benchmark their metrics and supporting segments against their average and against their peers. By doing so, they can gauge the health of their program and identify opportunities to shift strategy. Benchmarks also give leaders another way to easily introduce quantifiable metrics into conversations with their board.
Making It Easy for Leaders to Measure What They Manage
Security leaders shouldn’t have to exhaust extra time and effort finding ways to prove their business value. With Censys’ trends and benchmarks metrics, they don’t have to. Security program impact is automatically measured and made accessible to leaders and their teams from Censys’ user-friendly dashboard views. These industry-standard metrics are also rich with context and intended for executive-level discussion, so that leaders can have meaningful conversations with their stakeholders, and importantly, secure the investment they need.
Check out the trends and benchmarks metrics demo for a detailed look at how these metrics appear in Censys’ Exposure Management solution! You can also find more detail in our trends and benchmarks support article.
Interested in learning more? Reach out to us! Our team is happy to chat and answer any questions you may have.
LEARN MORE