Introduction
The other day, I found something weird on the Internet. A cluster of hosts was running an unrecognized service – all on port 55555, all on one autonomous system, and all with the same cryptic two-character service banner.
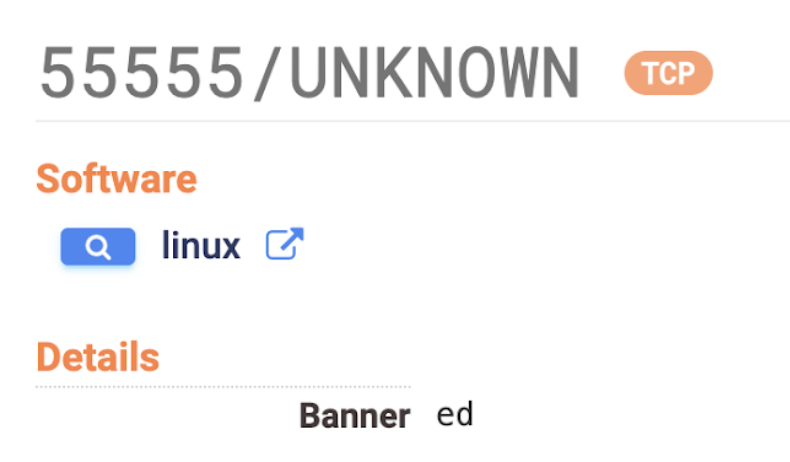
A strange combination of characteristics
This is unusual – particularly because of this unique banner message – but not surprising. The Internet is a big and weird place. Sometimes while digging around, we find things that seem amiss: a group of devices that suddenly go offline, control panels on the Internet with no authentication, software claiming to be one version when it’s actually another. At first glance, it’s too soon to say whether these phenomena are benign or something of concern. That’s why it’s critical to have a tool you can use to quickly gather more intel.
In this post I’ll be showing you how to do just that using Censys Search.
Recap: What does Censys do?
As a refresher, Censys is a leading internet asset discovery platform. Censys maintains the most comprehensive view of the public internet in the world by continually scanning the entire public IPv4 address space across 3,592+ ports from multiple global perspectives. It uses automatic protocol detection to identify the services running on each port, such as HTTP, SSH, etc. See this more in-depth guide to how Censys scans the internet.
Censys Search is a great tool for discovering Internet artifacts. It provides an intuitive interface to our Hosts and Certificates datasets that is well-suited for both bird’s-eye view browsing as well as drilling down to find a needle in the haystack. For the purposes of this article, we’ll focus on the Hosts dataset.
Evaluating “Weirdness” of an Observation
Ok, so you’ve found something weird. Like any good internet spelunker, you need a map of sorts for how to go about your investigation. Here’s a rudimentary list of questions that might lead to understanding what this weird thing could be:
- How widespread is this observation? How many hosts display these characteristics?
- What autonomous systems are these hosts distributed across?
- What geographic regions are these hosts located in?
- What other services are these hosts running?
- Was there a spike in the number of active hosts displaying these characteristics on a certain day?
While the first four of these questions can be answered using Censys Search, the fifth question requires us to expand our toolset. We’ll need to access snapshots of the Universal Internet Dataset in Google BigQuery. Let’s tackle these questions in order in the following sections.
Evaluating Scope
Censys Search makes it easy to quickly determine the public-facing footprint of an Internet phenomenon.
Each particular host in Censys Search is populated with detailed information about its IPv4 address, autonomous system, open ports, services running on those ports, and much more. These attributes are also searchable entities. For example, we could search for all detected hosts located in Ireland that are running SSH. (See documentation of all searchable fields that are populated for each host.)
When faced with loads of data, we want to hone in on the attributes that make our observed host “weird” so that we can narrow our focus. Here are a few that tend to be useful:
- service.port
- services.service_name
- services.banner
- autonomous_system.name
Rewinding to our first research question:
???? Q1: How many hosts display these characteristics?
We can tackle this by writing a Censys Search query that will grab all the hosts that match those characteristics. Along with the matching hosts, Search will also return the total number of results, the time it took to grab them, and a breakdown of the results by some basic filters.
In my case, I wanted to filter for hosts with one specific combination of autonomous system, port, service, and banner message. My Censys Search query looked something like this:
autonomous_system.asn=ASNx

AND same_service(service.port=PORTx

AND services.service_name='UNKNOWN'

AND services.banner=’BANNERx’

AND services.truncated=`false`)
(line breaks added for clarity)
Adding that handy services.truncated=false at the end of the query will exclude any hosts that are running more than 100 services, which can often be a marker of honeypots or pseudo services. To learn more about the truncated field, refer to the Search FAQ.
Using “:” instead of “=” is the syntax for running a “fuzzy” search that doesn’t require an exact match. This is best for cases where you only have a keyword or snippet to go on. To learn more about how to write well-formed Censys Search queries, see the Search documentation and a few example Host queries.
Running the above query took 0.34 seconds and returned 303,311 results:
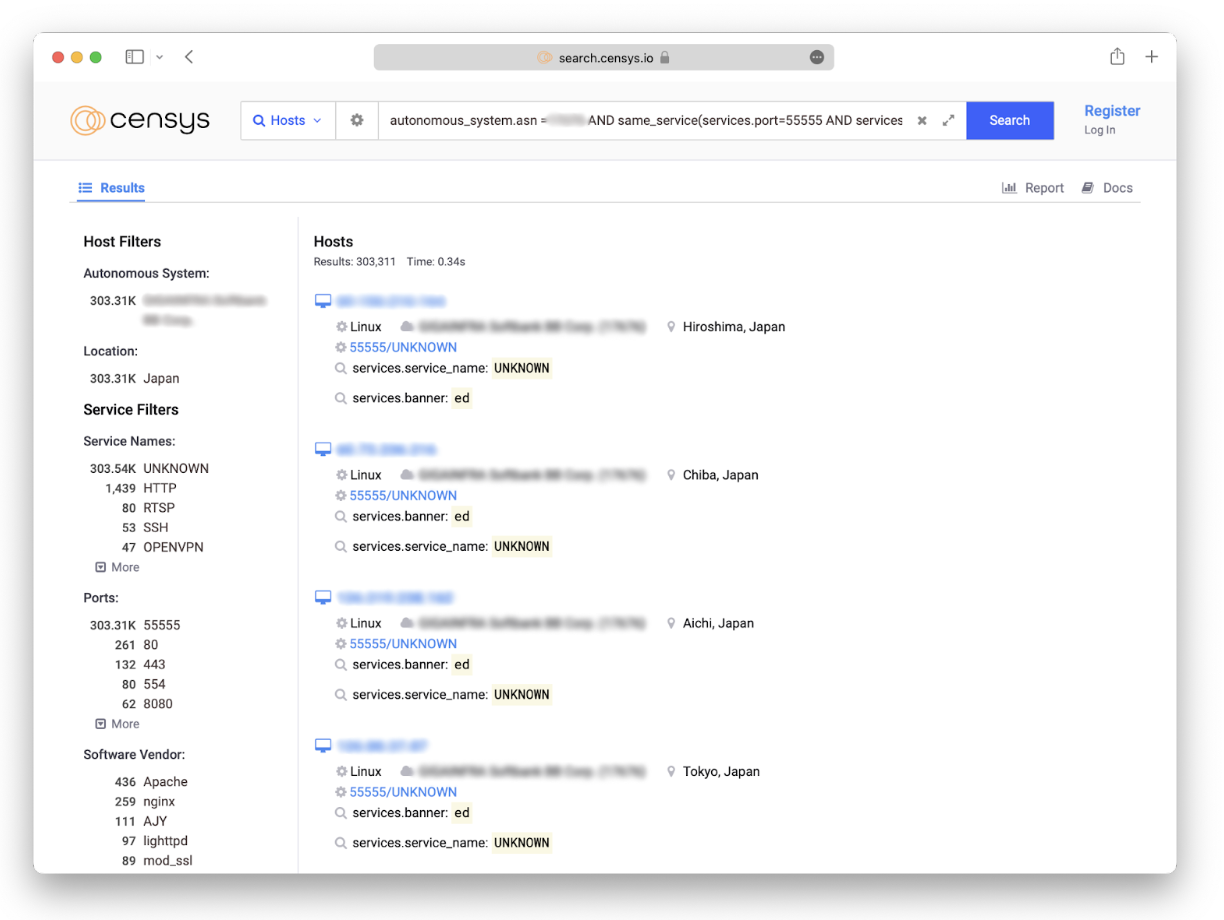
In the grand scheme of things, that’s not an enormous number of hosts…but it’s also not a small number. Let’s continue down our list of questions.
Characterizing an IP Space
Now that we have an easily indexable list of all our “weird” hosts, we can dig deeper into their other characteristics using the Reports feature of the Censys Search interface.
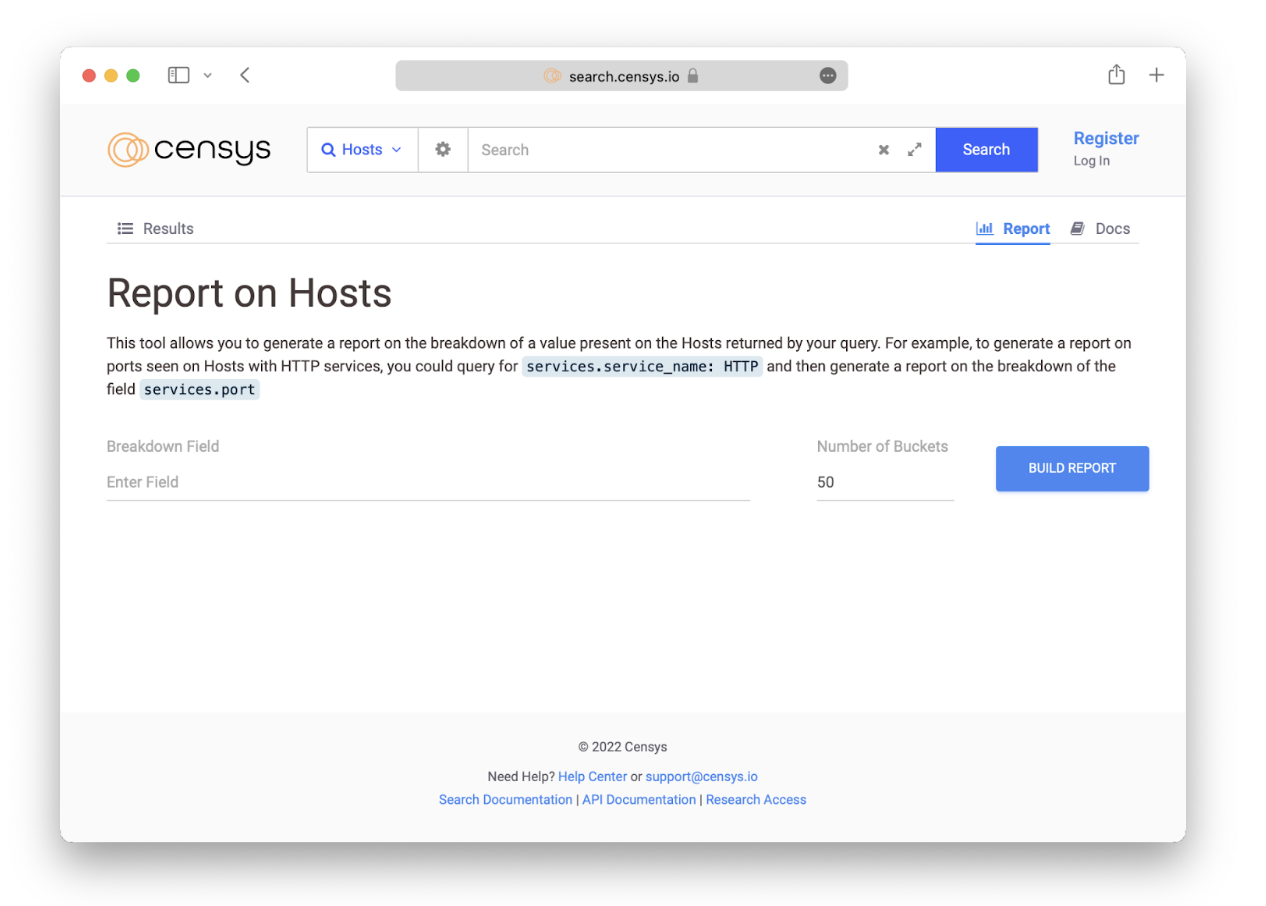
Reports offers an easy way to look at a breakdown of search results, allowing us to see how search results compare with each other across a specific attribute. To access it, simply click on the Report tab in the upper right hand corner of the search results page.
???? Q2: What autonomous systems are these hosts distributed across?
We can easily get a breakdown of our “weird” hosts by autonomous system by generating a report and specifying the attribute autonomous_system.name or autonomous_system.asn as the Breakdown Field.
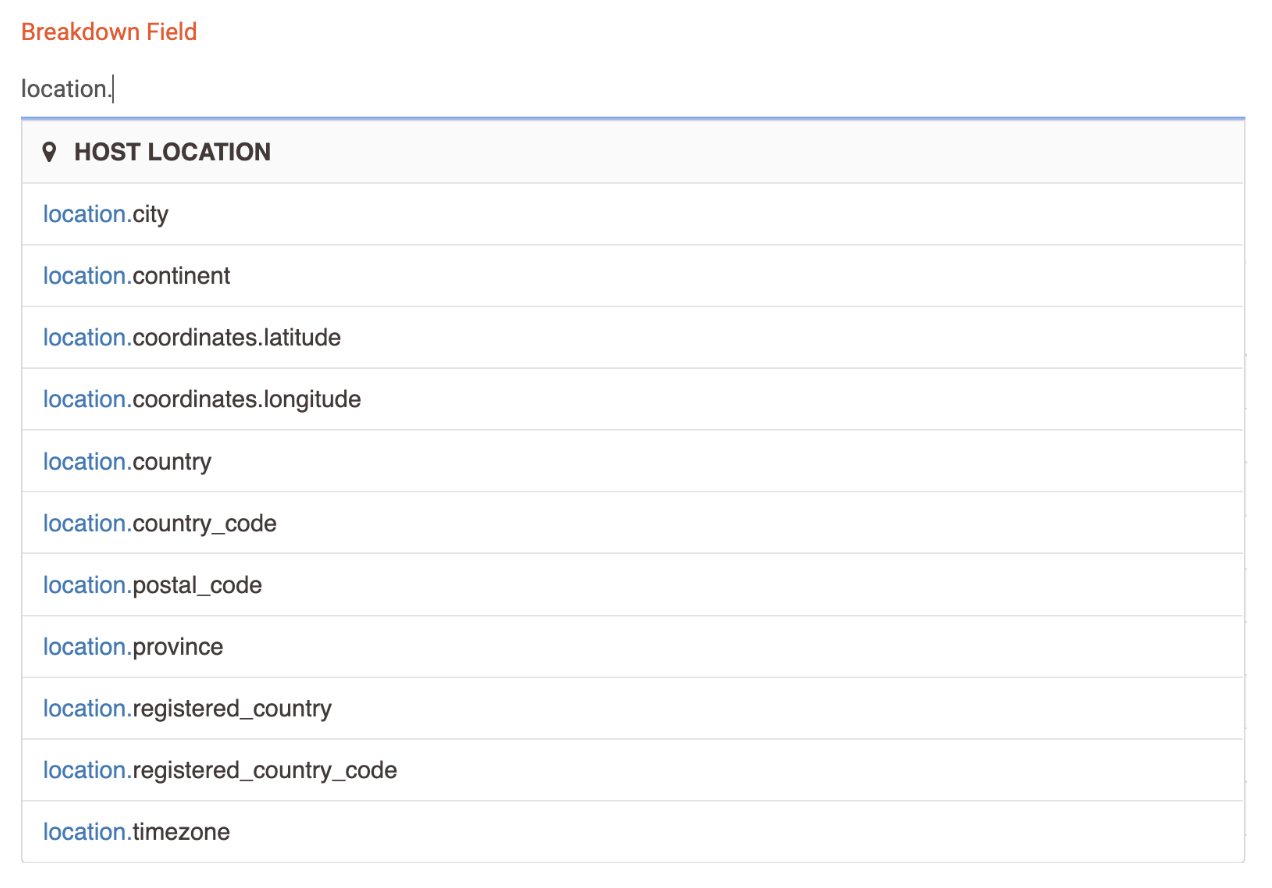
???? Q3: What geographic regions are these hosts located in?
Ditto the above, except now we can set our Breakdown Field to any one of the attributes under the location field, depending on whether we want to investigate at the scale of cities, countries, continents, etc:
???? Q4: What other services are these hosts running?
Each service running on a host is captured by the services.service_name attribute. Generate a report with this attribute set as the Breakdown Field to get further insight, noting that there can be multiple services running on one host. Keep your eyes peeled for any services that are particularly known to be frequently exploited by threat actors, such as SMB, RDP, and FTP.
Here’s our Report:
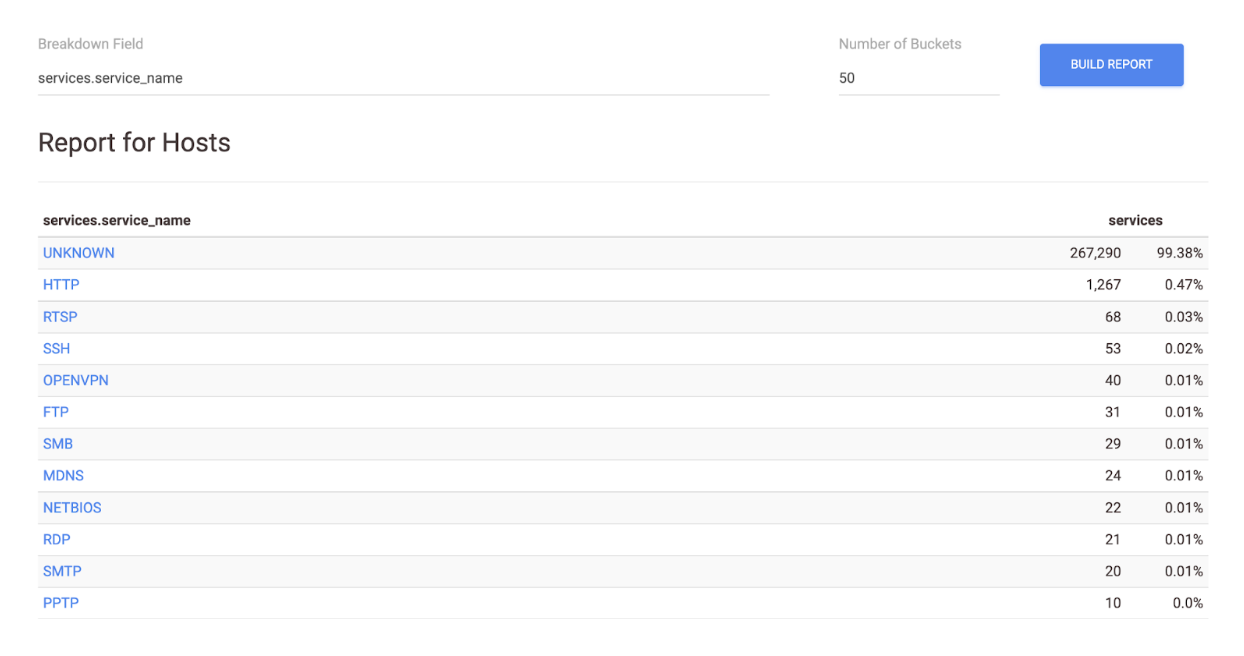
At the very top, we see that a whopping ~99% of our weird hosts are running some service labeled “UNKNOWN.” What does that mean?
Censys can detect 105 Layer 7 protocols (a.k.a. services). While these automatic protocol detection techniques are pretty sophisticated, sometimes they come up inconclusive – either because the service doesn’t adhere to the protocol in some way or because we don’t have a protocol-specific scanner written for it. When the scanner is not able to recognize the service running on a particular port, it categorizes it as UNKNOWN. It could be interesting to dive deeper into what these UNKNOWNs might be, but the presence of them typically isn’t an indicator of anything suspicious on its own.
Going down the report, HTTP is the second most common service represented. That checks out, since HTTP makes up most of the services we see in Censys’s scan data.
Scanning the whole list, it looks like there’s a smattering of hosts running FTP, SMB, and RDP. That warrants a little more snooping. Click on any of the cells in the report to go to the Censys search results for that subset of hosts. Examine several of the results, looking at their HTTP response bodies, banner messages, TLS certs, and software versions for anything that seems amiss. Are there any fishy JavaScript elements? Expired or self-signed certs? Software associated with known CVEs? This is not an exhaustive analysis, but it suits our goal of getting a quick feel for what we’re dealing with.
Overall, I didn’t find anything blatantly concerning here. Onward to the next question!
Analyzing Historical Trends
Visualizing the fluctuations in the number of active hosts that match these characteristics over time is another key piece of information. A significant increase or decrease in hosts on a certain day could indicate a number of suspicious events, for example the potential start of a threat incident.
???? Q5: Was there a spike in the number of active hosts displaying these characteristics on a certain day?
To answer this question, we’ll need to step beyond the Censys Search Web UI and API. Searches executed on these platforms are always run against hosts in the most recent snapshot of Censys’s Universal Internet Dataset. In order to get historical data, we need to run our query over snapshots from multiple days.
On any host page in the Search interface, navigating to the History tab will show you a historical chronology of events, but searches using history are not currently supported. Historical data can be pulled by running SQL queries through Google’s BigQuery interface. Enterprise customers who download or access daily snapshots in BigQuery can search the Internet as it was observed by Censys at a historical point in time.
The SQL query below counts every unique IPv4 address with services that matches our search criteria between the range of two dates, grouped by each day. The LAG() function here calculates the difference in number of hosts from one day to the next.
The criteria under the WHERE clause in the SQL query will have similar syntax to our earlier Censys Search query.
WITH

active_hosts AS (

SELECT

DATE(snapshot_date) AS day,

APPROX_COUNT_DISTINCT(host_identifier.ipv4) AS ipcount

FROM

`censys-io.universal_internet_dataset.universal_internet_dataset`,

UNNEST(services) AS svc

WHERE

autonomous_system.asn=ASNx

AND svc.port=PORTx

AND svc.service_name = 'UNKNOWN'

AND SAFE_CONVERT_BYTES_TO_STRING(svc.unknown.banner)=’BANNERx’

AND svc.truncated=`false`

AND DATE(snapshot_date) BETWEEN '2022-05-01' AND '2022-06-14'

GROUP BY

day

ORDER BY

day

)

SELECT

day,

ipcount,

ipcount - LAG(ipcount) OVER (ORDER BY day ASC) AS delta

FROM

active_hosts

GROUP BY

day,

ipcount

ORDER BY

day
It can also be helpful to compare the trends in “weird” hosts side-by-side with trends in a larger subset of hosts, such as the broader country or industry. In my case, I wanted to analyze trends in all of the active hosts under this particular autonomous system. To broaden the group of hosts you pull historical data for, adjust the filters under the WHERE clause in the SQL query above:
WHERE

autonomous_system.asn=ASNx

AND DATE(snapshot_date) BETWEEN '2022-05-01' AND '2022-06-14'
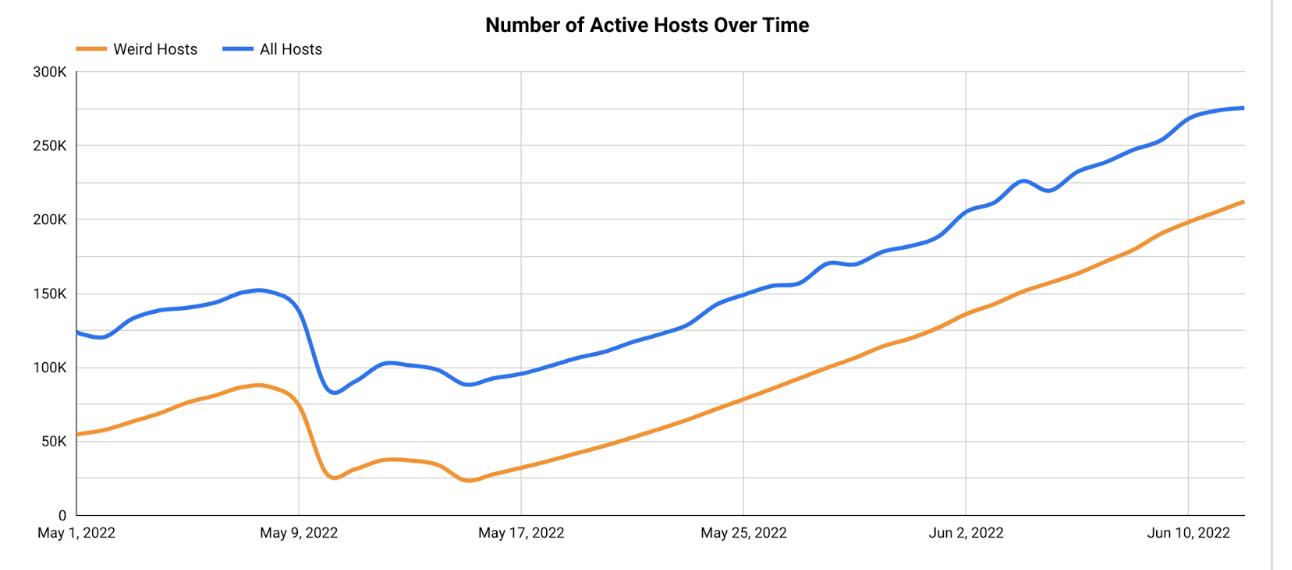
This visualization isn’t very useful to us until we know how to attach meaning to the patterns we see.
When looking at fluctuations in internet hosts, there are a few things that should raise some red flags for us. Any sort of large, sudden change in the data is suspicious – such as a large spike or trough on a particular day. The former could indicate the scaling of something malicious, whereas the latter could represent connectivity problems such as an outage, scheduled maintenance, or a security incident. In addition, pay attention to any patterns in one trendline that aren’t reflected in the others. These anomalies might hint that something unintended is happening on those machines.
Let’s make some initial observations of our graph:
- The trends in our “weird” hosts track pretty closely with those of all hosts in this Autonomous System.
- There is a hump in the data toward the beginning of May, but it’s relatively small (~50K increase) and gradual, taking place over longer than a week.
- There are two troughs following that, but again they’re both pretty minor and take place over the course of multiple days.
- Notice the continuous increase in both trend lines starting from around mid-May and continuing into June.
Conclusion: weird, but not malicious
From this brief analysis, it appeared more likely that the “weird” hosts are not anything explicitly malicious. The similarity between the two trendlines and relatively slow rate of the changes in our historical data visualization suggests that these hosts may be part of this network’s intended infrastructure scaling. There is still the possibility that this is something malicious – but now we have a solid hypothesis to report!
Remember that the Internet is a BIG, weird, and constantly changing place. With just a few tools, we were able to understand a small chunk of this cyberspace. If you know which questions to ask, Censys Search data can help build a bridge to the insights that answer them. Now we have a valuable springboard for a deeper exploration of this phenomenon.
Summary
Censys Search is an invaluable tool for both seasoned security researchers and hobbyists alike for investigating questions about the Internet. Check out the Search 2.0 Quick Start Guide for a more thorough walkthrough of the Search web interface.
Remember: if you see something weird, follow the trail. You never know what you might discover. Happy spelunking!