

Introduction
Hello and welcome to the 2025 edition of the Censys State of the Internet Report! In previous reports, we’ve focused on various facets of the Internet, including a look at web technologies and exposed ICS devices. This year, we turned our attention to adversary infrastructure: Command and Control infrastructure (C2) and other tools leveraged by threat actors to attack and compromise systems.
C2 infrastructure is used to manage and communicate with compromised devices, typically as part of malware or botnet operations. They’re a sort of evil twin of IT endpoint management tooling, allowing threat actors to remotely monitor, issue commands, exfiltrate data, and coordinate actions across multiple compromised devices. Beyond C2 and other malware, we’ll explore the use of compromised residential network devices recruited into adversary operations. This tactic leverages SOHO (small office/home office) edge devices to proxy attack traffic, which has helped groups like Volt Typhoon evade detection.
At Censys, we are the authority in Internet intelligence and insights. We maintain the most comprehensive map of the Internet, enabling security teams to uncover risks, identify threats, and strengthen defenses. Our unparalleled visibility allows us to generate the most accurate and timely snapshots of threat actor infrastructure. Over the coming weeks, we’ll be publishing a series of blogs that each examine adversary infrastructure through a different lens. Some topics you can look forward to include:
- Threat investigations, disruptions and takedowns, and the use of publicly exposed devices as initial entry vectors
- Lifespans of various C2 servers and how they differ across bulletproof hosting providers and other cloud providers
- The use of residential network devices as proxies for malicious activity
We’ll begin with a broad look at the malicious infrastructure landscape as observed by Censys. Specifically, we’ll examine 80 of our malware detections over a period of 6 months from December 2024 to May 2025. Families studied include Cobalt Strike, Sliver, Mythic, PlugX, and more. We acknowledge that there are many interesting ways to study this data, but the exploration below is shared in hopes of providing context for what’s to come throughout this blog series.
Malware Detection Trends
We note that numbers in this report reflect our top malware detections as of May 2025. We regularly add and update these detections, and top families are subject to change based on detection logic and shifts in the threat landscape.
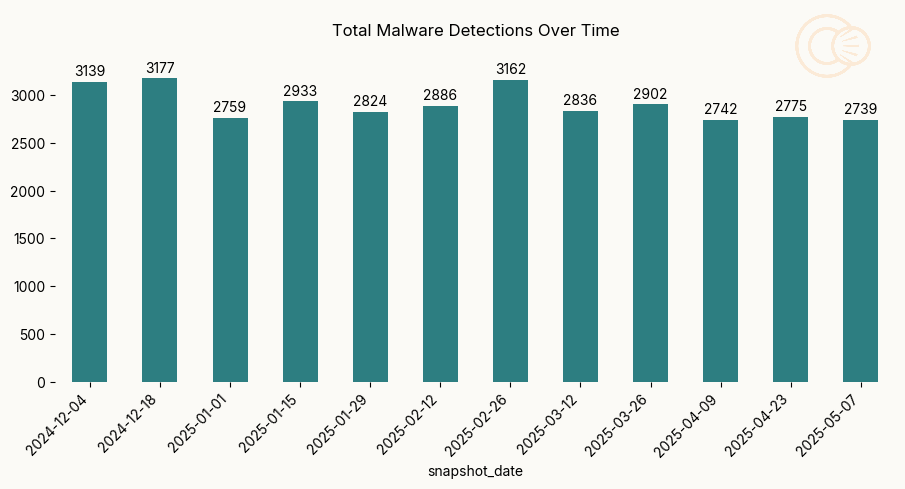
During the six-month study time frame, we observe an average of 2,906 malware detections for each snapshot date. Mid-December marks the greatest number we observe online during the period. Following the peak in December, we observed a 14% drop in detections in early January. This appears to be primarily driven by a drop in Cobalt Strike instances in China, where they are largely concentrated.
Though it has origins as a pentesting and red teaming tool, Cobalt Strike has been widely adopted by threat actors since its initial release over 10 years ago. In addition to C2 functionality, it offers extensible post-exploitation tooling attractive to security professionals and threat actors alike.
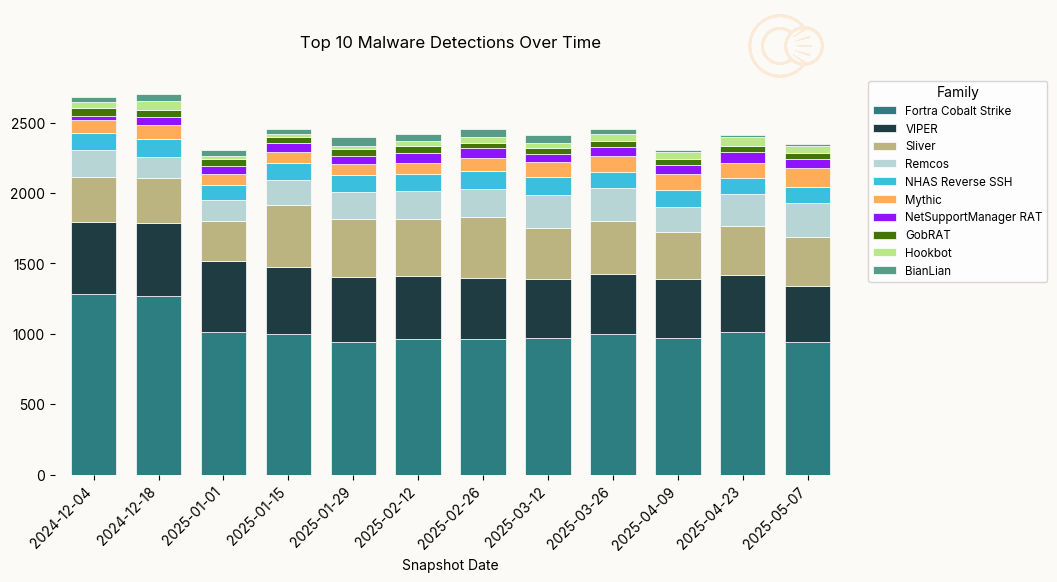
Despite the decline into January and takedown efforts spanning two years, Cobalt Strike consistently had the greatest observed Internet presence of the detections we examined during the study period–it represents 34% of the C2s we observed as of May 2025.
The next largest families during this timeframe, Viper (15% of total) and Sliver (13% of total), together represent roughly one third of C2s we observed as of May 2025.
While Cobalt Strike is a commercial tool, Viper and Sliver are open source alternatives for adversary emulation. Viper and Sliver are slightly younger projects than Cobalt Strike, but their availability has likely contributed to their popularity.
We can also find interesting exposure patterns when we look beyond the most common families shown above. Consider PlugX as an example:
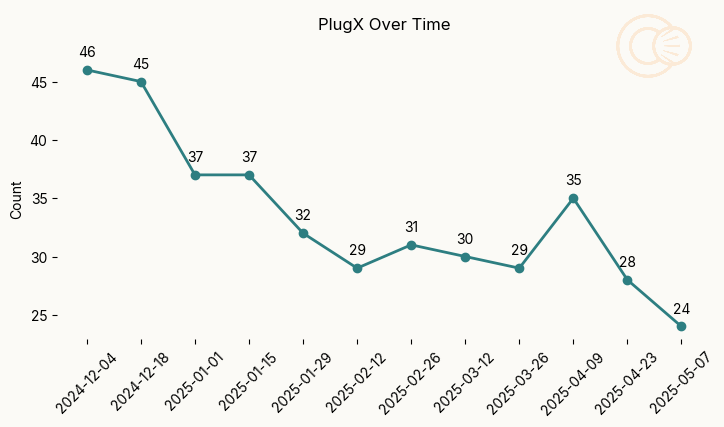
PlugX is a remote access trojan (RAT) known since 2008 and used by China-linked threat actors such as APT41 and Mustang Panda.
We generally observe a decline in PlugX instances over the study timeframe, apart from a slight but short-lived uptick in early April 2025. This decline follows news of a takedown from the U.S. Department of Justice in January 2025, which states,
Geography Trends
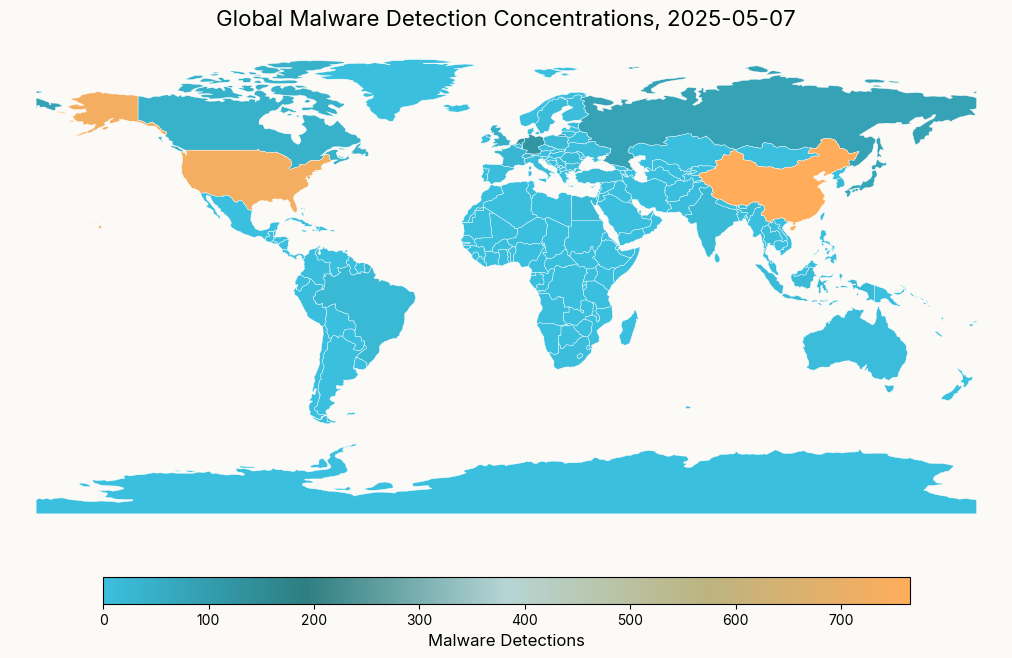
As of May, we observed detections in a total of 62 countries globally, with China and the U.S. topping the list and hosting 55% of malware collectively. Beyond the U.S. and China, we observe concentrations of malware in Asia, Europe, and North America.
Top 10 countries where we observe malicious infrastructure as of May 2025
It can be tempting to look for deeper meaning in geographic regions with high concentrations of malicious infrastructure, but rather than having geopolitical significance, concentrations of malware are more likely driven by hosting provider availability, pricing, and permissiveness.
Network Trends
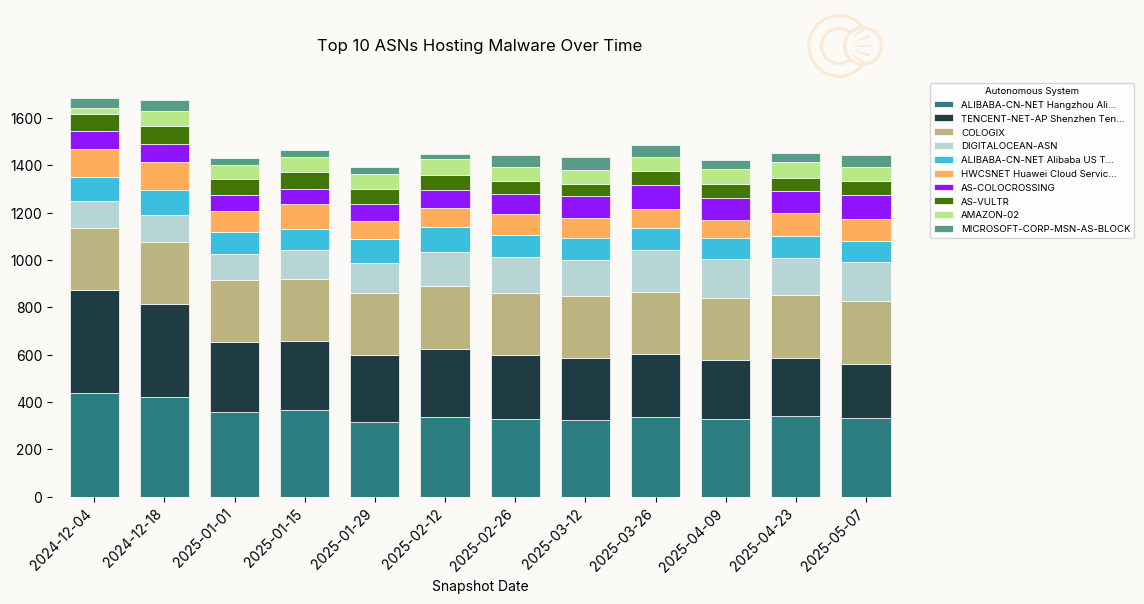
China-based providers Alibaba and Tencent top the list of where we observe the greatest volume of malware detections across the snapshot dates studied, and Huawei’s Cloud Service also makes the top 10. Rounding out the list are several U.S.-based providers, including Cologix, Digital Ocean, Colocrossing, Vultr, Amazon, and Microsoft.
While these autonomous systems (ASes) track closely with the major geographic concentrations of detections, it’s also useful to consider where more rare but interesting infrastructure resides. We continue with our PlugX example below.
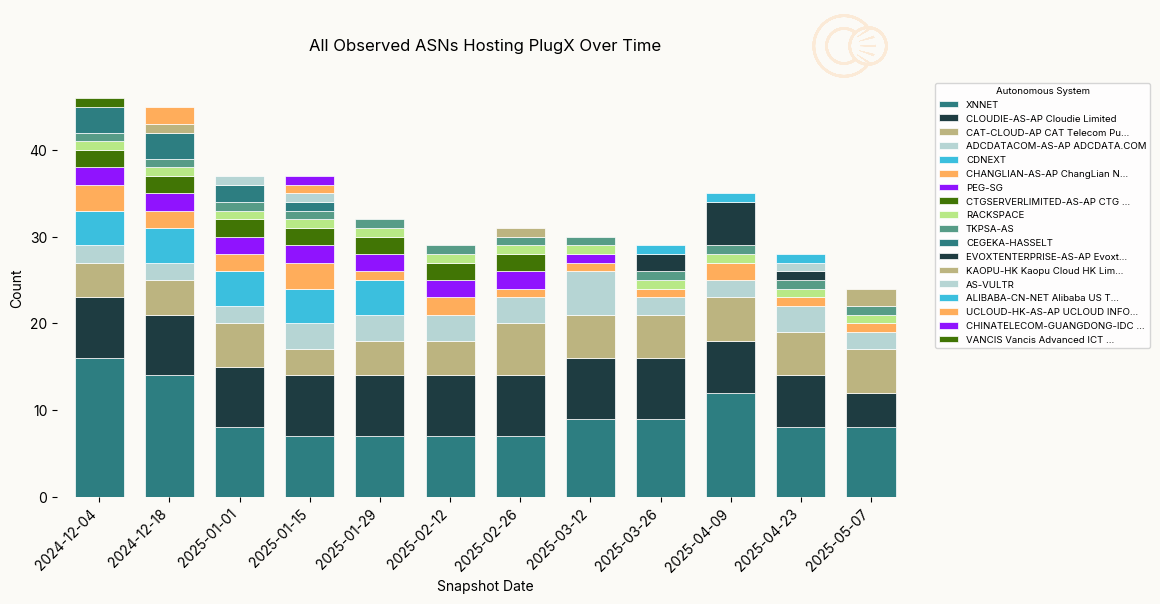
In examining all ASes where we observe PlugX, we note minimal overlap with the global top ASes where we observe C2 infrastructure. The only shared ASes are Vultr and Alibaba, which could point to more specific or discerning operations by PlugX operators.
XNNET, a U.S.-based provider, tops the list of networks where we observe PlugX, followed by Hong Kong-based Cloudie and CAT Telecom, based in Thailand.
Conclusions
We observe an average of 2,906 malware detections across each snapshot date studied. Mid-December 2024 marks the greatest number of detections we observe during the period. Following the peak in December, we observe a 14% drop in malware detections in early January, which appears to be largely driven by a drop in Cobalt Strike instances.
The largest concentrations of malicious infrastructure we observe across a six-month period are found in China and the U.S., with presence across 62 countries globally. Parallel to our observations about geographic concentrations of detections, we find the greatest network concentrations on two China-based providers (Alibaba and Tencent) and a U.S.-based provider (Cologix).
However, the largest numbers and concentrations of infrastructure don’t always paint the full picture. As an example of a less common but interesting family, we explored the exposure and network distribution of PlugX, a tool often used by China-linked threat actors.
With this, we’ve merely scratched the surface of malicious infrastructure. Over the coming weeks, we’ll continue to explore various aspects of malicious and adversary-controlled infrastructure on the Internet.
—-