


Some time ago, we released an open-source utility called Censeye that came from one of our internal pivoting workflows. The idea was simple: take every field from a Censys host result (of which there are many) and generate a report showing how many other hosts on the Internet share that exact field and value. This turned out to be surprisingly helpful. It helped us identify meaningful pivots and find related infrastructure tied to the hosts of interest in an efficient manner.
The downsides were query usage and load times. Each field required a call to the reporting API, and collecting host details for matches involved two additional API calls. That overhead added up fast. To keep things manageable, we narrowed the set of fields used for reporting and introduced a soft limit on the number of hosts included in recursive pivots. This helped improve performance and reduce API consumption, but it also meant that we could potentially overlook specific details in the process.
We also implemented the basic constructs of this technique in the Platform UI, where we could get a count of hosts for a small subset of fields within the host data, like so:

While great for a cursory look at a given host, this data could not be pulled into external utilities for further analysis, and the ability to tailor the fields is not possible.
These trade-offs aren’t necessary anymore!
A new endpoint was recently added to the Censys Threat Hunting Module that combines multiple individual calls into one request. The value-counts API endpoint lets you send a structured list of field-value queries and returns an array of counts: one for each condition. It also supports nested input so that you can batch a large number of ANDed queries into a single API call.
A simple example
For example, imagine you want to check how many hosts on the Internet match the following two conditions:
host.services.banner_hash_sha256 = "1934f57e4417ce5d3ec63047e79fd1a874f6704c038bae87c8f6473b4cad987d"
host.services.cert.fingerprint_sha256 = "1b71165c498eea0ccb2b50478b5c1ac6632342af42b5c672df8a8a073a89f948"
Previously, you’d have to make two separate calls to the reporting API. Now you can combine both into a single value-counts request:
{
  "and_count_conditions": [
    {
      "field_value_pairs": [
        {
          "field": "host.services.banner_hash_sha256",
          "value": "1934f57e4417ce5d3ec63047e79fd1a874f6704c038bae87c8f6473b4cad987d"
        }
      ]
    },
    {
      "field_value_pairs": [
        {
          "field": "host.services.cert.fingerprint_sha256",
          "value": "1b71165c498eea0ccb2b50478b5c1ac6632342af42b5c672df8a8a073a89f948"
        }
      ]
    }
  ]
}
The response will look something like this:
{
  "result": {
    "and_count_results": [
      154507,
      14
    ]
  }
}
Each number in the and_count_results array matches the condition in the same order. In this case, the banner hash shows up on over 150,000 hosts, while the certificate fingerprint is much rarer, appearing only on 14 hosts. This makes it much easier to ask “How unique is this value across the Internet?” without burning multiple API calls to find the answer.
Getting more advanced
But, fetching these values is only half the battle. The real challenge lies in deciding which fields are worth investigating. While the API doesn’t make that choice for you, it gives you all the pieces you need to build that logic yourself. The process may sound straightforward for “I want to generate a value-counts report for a single host”:
- Retrieve the raw host data from Censys.
- Walk through every field in the JSON and extract all valid field/value pairs.
- Construct a valid CenQL for each key/value pair.
- Deduplicate and optimize the resulting set of pairs.
- Send the pairs over to the new value-counts API
- Map the returned values back to the queries that created them
That said, doing this manually can be a bit tedious in practice. To streamline the process, the Censys research team built an example API and a set of example tools that leverage this new endpoint effectively. For example, if you wanted to generate a list of potential fields to count based on an input host, you could construct a small bit of code that uses this example API like the following (compile_rules.go):
package main

import (
	"encoding/json"
	"fmt"
	"io"
	"log"
	"os"

	"github.com/censys-research/censeye-ng/pkg/censeye"
)

func main() {
	// read censys host data from stdin
	data, err := io.ReadAll(os.Stdin)
	if err != nil {
		log.Fatalf("error reading stdin: %v", err)
	}

	// based on the host data, generate a list of matching rules
	compiled, err := censeye.CompileRulesFromHostResult(data)
	if err != nil {
		log.Fatalf("error compiling rules: %v", err)
	}

	// output the raw value-counts query in JSON
	out, err := json.Marshal(compiled)
	if err != nil {
		log.Fatalf("error marshalling output: %v", err)
	}
	fmt.Println(string(out))
}
We can use this code to generate a set of rules for any given host automatically. For example, here’s how you can fetch host data from Censys and pipe it into this program, which transforms the host’s structure into a ready-to-use value-counts request:
% curl -s -X GET
  "https://api.platform.censys.io/v3/global/asset/host/122.6.3.201?organization_id=${CENSYS_PLATFORM_ORGID}"
  -H "accept: application/vnd.censys.api.v3.host.v1+json"
  -H "authorization: Bearer ${CENSYS_PLATFORM_TOKEN}" | go run compile_rules.go
This will produce structured output like the following:
{"and_count_conditions":[
  {"field_value_pairs":[
    {"field":"host.services.endpoints.path","value":"/login/index"}
  ]},
  {"field_value_pairs":[
    {"field":"host.services.endpoints.banner_hash_sha256","value":"c74f4818445b6a927e345bf04e7f82a3f5e2b59f776d65997faad3665a62443c"}
  ]},
  {"field_value_pairs":[
    {"field":"host.services.endpoints.http.headers.key","value":"Server"},
    {"field":"host.services.endpoints.http.headers.value","value":"beegoServer:1.12.0"}
  ]},
  {"field_value_pairs":[
    {"field":"host.services.endpoints.http.headers.key","value":"Set-Cookie"},
    {"field":"host.services.endpoints.http.headers.value","value":"beegosessionID=dac005c76732f817a41352fc23ffce37; Path=/; HttpOnly"}
  ]},
  {"field_value_pairs":[
    {"field":"host.services.endpoints.http.html_tags","value":"<title langtag="title-login"></title>"}
  ]},
  {"field_value_pairs":[
    {"field":"host.services.endpoints.http.body_hash_sha256","value":"f42817e3145ddf0a810e4150f0ab768b78b487b617d36c8210df646e55ebcee2"}
  ]},
  {"field_value_pairs":[
    {"field":"host.services.endpoints.http.protocol","value":"HTTP/1.1"},
    {"field":"host.services.endpoints.http.status_code","value":"200"},
    {"field":"host.services.endpoints.http.status_reason","value":"OK"},
    {"field":"host.services.endpoints.http.html_title","value":""}
  ]}
]}
In short, we fetch a host from the Censys API and pipe the JSON directly into compile_rules.go, which inspects the host structure and generates a value-counts request containing the most relevant field/value pairs without having to pull out the fields manually.
Those rules above can also be thought of as seven independent CenQL queries:
Continuing with our example, we can automate most of the workflow by chaining three commands together:
- Fetch the raw host data from the Censys API using curl
- Compile detection rules from that host using the local tool (compile_rules.go)
- Submit those rules to the value-counts API to see how many hosts match each one
Here’s what this pipeline looks like in practice:
% curl -s -X GET
  "https://api.platform.censys.io/v3/global/asset/host/122.6.3.201?organization_id=${CENSYS_PLATFORM_ORGID}"
  -H "accept: application/vnd.censys.api.v3.host.v1+json"
  -H "authorization: Bearer ${CENSYS_PLATFORM_TOKEN}" |  # Step 1: Fetch host details
go run compile_rules.go |                                # Step 2: Compile rules from host data
curl -s -X POST
  "https://api.platform.censys.io/v3/threat-hunting/value-counts?organization_id=${CENSYS_PLATFORM_ORGID}"
  -H "accept: application/json"
  -H "authorization: Bearer ${CENSYS_PLATFORM_TOKEN}"
  -H "content-type: application/json"
  --data-binary @-                                        # Step 3: Submit rules and get counts
The response from the value-counts API includes an array of counts, one for each rule:
{
  "result": {
    "and_count_results": [
      24082,
      1,
      18828,
      1,
      21306,
      27,
      5118165
    ]
  }
}
Each number in the “and_count_results array” corresponds to one query generated from the host. In this example:
- The first query matched 24,082 hosts
- The second matched only one host (likely the original one we queried)
- The sixth query matched 27 hosts, suggesting it’s relatively unique
- The last query matched over five million hosts, indicating it’s very common and probably not very useful
Structurally, the output data looks like this:
Row six (body_hash_sha256) matched only 27 other hosts across the Internet. That low number suggests it’s highly specific, probably tied to a particular application or deployment. It’s a strong candidate for uncovering related infrastructure.
This is the core idea behind Censeye: take what’s unique about a host, find where else it appears, and use that to expand your visibility. It’s a simple approach, but it can surface cool things.
It should be noted that this “censeye.CompileRulesFromHostResult()” function doesn’t just generate a one-to-one list of rules from the host data. It adds two key features:
- Field filtering: It automatically skips fields that aren’t statistically meaningful, such as booleans or common field-value pairs that appear across millions of hosts and offer little value for pivoting.
- Compound rule generation: It combines related fields into a single logical statement when appropriate. For example: http.protocol=HTTP/1.1 and http.status_code=200
This compound rule is included alongside the individual field-value rules for full coverage.- A query like http.status_code=200 alone might match millions of hosts, but when combined with something like http.status_reason=”weird”, it can surface rare or interesting patterns that would otherwise be lost in the ether.
While this little example works, it highlights some of the friction involved; you still have to fetch the host manually, compile the rules, and then query the value-counts API. That’s a lot of boilerplate just to get a simple report. Fortunately, the example Censeye API simplifies that entire process. With just a few lines of code, you can fetch the host, generate rules, and query the value-counts API, all in one step.
Here’s a small example code snippet that does exactly that.
package main

import (
	"context"
	"fmt"
	"os"

	"github.com/censys-research/censeye-ng/pkg/censeye"
	censys "github.com/censys/censys-sdk-go"
)

func main() {
	if len(os.Args) < 2 {
		fmt.Printf("Usage: %s <ip>n", os.Args[0])
		os.Exit(1)
	}

	// create a Censeye client using an underlying Censys SDK client
	client := censeye.New(
		censeye.WithClient(censys.New(
			censys.WithSecurity(os.Getenv("CENSYS_PLATFORM_TOKEN")),
			censys.WithOrganizationID(os.Getenv("CENSYS_PLATFORM_ORGID"))),
		),
	)

	// run the Censeye client with the provided IP address at a depth of zero
	// This will fetch the host from Censys, compile the relevant rules, and
        // call the value-counts API using those rules
	res, err := client.Run(context.Background(), os.Args[1])
	if err != nil {
		fmt.Fprintf(os.Stderr, "error running censeye: %vn", err)
		os.Exit(1)
	}

	// For each host we queried, print out a short summary report from the results
	for _, report := range res {
		for i, row := range report.GetData() {
			fmt.Printf("[%03d] %10d %sn", i, row.GetCount(), row.GetCenqlQuery())
		}
	}
}
This little snippet creates a small, structured report where each row includes:
- An index
- The number of hosts that matched the query
- The CenQL query itself
For example:
[000] 5133938 host.services:(endpoints.http.protocol="HTTP/1.1" and endpoints.http.status_code="200" and endpoints....
[001]   24115 host.services.endpoints.path="/login/index"
[002]   21328 host.services.endpoints.http.html_tags="<title langtag="title-login"></title>"
[003]   18872 host.services:(endpoints.http.headers.key="Server" and endpoints.http.headers.value="beegoServer:1.12.0")
[004]      27 host.services.endpoints.http.body_hash_sha256="f42817e3145ddf0a810e4150f0ab768b78b487b617d36c8210df646e55ebcee2"
[005]       1 host.services.endpoints.banner_hash_sha256="c74f4818445b6a927e345bf04e7f82a3f5e2b59f776d65997faad3665a62443c"
[006]       1 host.services:(endpoints.http.headers.key="Set-Cookie" and endpoints.http.headers.value="beegosessionID=d...
How it works:
- A new Censeye client is created using “censeye.New()”, wrapping the official Censys SDK (“censys.New()”)
- This example assumes you’ve set “CENSYS_PLATFORM_TOKEN” and “CENSYS_PLATFORM_ORGID” in your environment
- The “Run()” method is called with:
- A valid golang context
- The IP address you want to analyze
- “Run()” returns an array of “censeye.Report” structures
- Each report includes a list of rule counts from the value-counts API via “report.GetData()”
- The script loops through each row and prints:
- The index of the rule
- The number of matching hosts
- The CenQL query associated with that rule
Cool, right? Now let’s take it a step further.
Auto-Pivoting
What if we want to automatically follow up on rules that return a low host count, like the body_hash_sha256 rule we saw earlier that matched only 27 hosts? That’s definitely something worth investigating. With Censeye, all we have to do is bump the search depth to 1, and the tool will pivot into those “interesting” queries and pull down new reports on every host that shares that attribute.
For readability, we can also tweak the output in our code above to show:
- The IP address and pivot depth for each report
- For brevity, only display report rows marked as interesting (i.e., uncommon enough to be worth pivoting into)
Our updated code looks like this:
package main

import (
	"context"
	"fmt"
	"os"

	"github.com/censys-research/censeye-ng/pkg/censeye"
	censys "github.com/censys/censys-sdk-go"
)

func main() {
	if len(os.Args) < 2 {
		fmt.Printf("Usage: %s <ip>n", os.Args[0])
		os.Exit(1)
	}

	client := censeye.New(
		censeye.WithClient(censys.New(
			censys.WithSecurity(os.Getenv("CENSYS_PLATFORM_TOKEN")),
			censys.WithOrganizationID(os.Getenv("CENSYS_PLATFORM_ORGID"))),
		),
	)

	// Run with a a depth of 1
	res, err := client.Run(context.Background(), os.Args[1], censeye.WithDepth(1))
	if err != nil {
		fmt.Fprintf(os.Stderr, "error running censeye: %vn", err)
		os.Exit(1)
	}

	for _, report := range res {
		fmt.Printf("Host: %s, Depth: %dn", report.GetHost(), report.GetDepth())
		for i, row := range report.GetData() {
			if row.GetIsInteresting() {
				fmt.Printf("[%03d] %10d %sn", i, row.GetCount(), row.GetCenqlQuery())
			}
		}
	}
}
Note that in this version, we’re slightly changing how we call the example Censeye API by passing an additional runtime option: “censeye.WithDepth(1)”. This tells Censeye to not only analyze the original host, but also automatically follow any queries with a low host count and repeat the same process on those matching hosts.
Here’s what the output for that code looks like in practice:
Host: 122.6.3.201, Depth: 0
[004]         27 host.services.endpoints.http.body_hash_sha256="f42817e3145ddf0a810e4150f0ab768b78b487b617d36c8210df646e55ebcee2"
Host: 8.148.104.187, Depth: 1
[016]         27 host.services.endpoints.http.body_hash_sha256="f42817e3145ddf0a810e4150f0ab768b78b487b617d36c8210df646e55ebcee2"
Host: 1.14.37.71, Depth: 1
[056]         27 host.services.endpoints.http.body_hash_sha256="f42817e3145ddf0a810e4150f0ab768b78b487b617d36c8210df646e55ebcee2"
Host: 42.243.43.98, Depth: 1
[009]         27 host.services.endpoints.http.body_hash_sha256="f42817e3145ddf0a810e4150f0ab768b78b487b617d36c8210df646e55ebcee2"
Host: 122.6.1.130, Depth: 1
[022]         27 host.services.endpoints.http.body_hash_sha256="f42817e3145ddf0a810e4150f0ab768b78b487b617d36c8210df646e55ebcee2"
[023]          2 host.services:(endpoints.http.headers.key="X-Timestamp" and endpoints.http.headers.value="1753134050")
While allowing the example API to pivot on any field found in Censys is powerful, it might not always be what you want. In some cases, you may prefer more control over which fields are eligible for recursive pivoting. That’s where the “config.WithPivotableFields()” option comes in. This configuration setting lets you explicitly define which fields Censeye is allowed to follow during depth-based searches.
For example, if you only want to pivot on:
- “host.services.cert.fingerprint_sha256”
- “host.services.endpoints.banner_hash_sha256”
You can configure the API like so:
censeyeConfig := config.NewConfig(config.WithPivotableFields([]string{
    "host.services.cert.fingerprint_sha256",
    "host.services.endpoints.banner_hash_sha256",
}))
… and then create a Censeye object with this configuration:
c := censeye.New(
	censeye.WithConfig(censeyeConfig),
	censeye.WithClient(censys.New(
		censys.WithSecurity(os.Getenv("CENSYS_PLATFORM_TOKEN")),
		censys.WithOrganizationID(os.Getenv("CENSYS_PLATFORM_ORGID")))))
When “censeye.Run()” is called, any field considered for pivoting will be checked against this list. If it’s not included, the example Censeye API will skip it entirely (but still report on it).
One of the biggest advantages of this value-counts API is that we no longer have to limit ourselves to a small predefined set of fields, unlike before. Because of this performance boost, we can afford to be much broader in what we decide to look at. By default, the example Censeye API takes a filter-out approach rather than a filter-in one, meaning it will evaluate all field/value pairs except for those known to be unhelpful or noisy.
Static key filters
These types of filters let you exclude entire fields (CenQL keys) from being evaluated. This is useful when specific fields are known to produce noisy or unhelpful outputs. They can be defined in one of two ways:
- By full path, for example, host.services.tls.version_selected will ignore just that specific TLS version field.
- By key prefix (and all descendants), for example, host.location. (note the trailing dot) will ignore everything under the host.location namespace, including things like host.location.country and host.location.province.
Note: The example Censeye API includes a default list of static filters defined in “config.DefaultFilters”, but you can override or extend this list using “config.WithFilters([]string)”
Filtering out specific fields is always helpful for eliminating duplicate or low-entropy data. For example, when a host has multiple hash values (MD5, SHA256, etc.), you make sure you’re always just using one. Additionally, things like boolean fields typically have little value since they can only ever be true or false.
CenQL regex filters
Regex filters are a more specific option. These can operate on the complete field/value pair of a CenQL using regular expressions. These are particularly good at excluding broad patterns of data that aren’t useful for analysis.
For example, common HTTP response codes that are seen everywhere don’t distinguish one host from another (but could be useful when combined with other fields), so to avoid wasting the credits and time processing them, you could include a filter like the following:
r"^host.services.endpoints.http.status_code="(200|301|302|307|400|401|402|403|404|503)"$"Note: The Censeye API ships with many default CenQL regex filters defined in “config.DefaultRgxFilters”, but can be manually set with the config option “config.WithRegexFilters(rules []*regexp.Regexp)”
Caching
This is also a good time to mention how the Censeye API does caching, which helps reduce redundant queries and speeds up repeated lookups. Currently, Censeye uses three types of caches:
- Key/value count cache – If the same key-value pair is used in multiple places (or across multiple hosts), it will only be queried against the value-counts API once.
- Host cache – Full host results from the Censys API are stored locally, so repeated lookups for the same IP or hostname won’t trigger new API calls.
- If it’s a historical host, the cache is tied to that specific date.
- Search cache – When pivoting into low-prevalence values, Censeye caches the list of hosts returned for each query to avoid repeating the same searches.
The default cache duration is seven days, but you can easily customize this. For example, if you’re running short-lived sessions or want to ensure everything is fetched fresh on each run, you can altogether disable caching by setting the duration to zero:
client := censeye.New(
    censeye.WithClient(censys.New(
        censys.WithSecurity(os.Getenv("CENSYS_PLATFORM_TOKEN")),
        censys.WithOrganizationID(os.Getenv("CENSYS_PLATFORM_ORGID")),
    )),
    censeye.WithConfig(
        config.NewConfig(
            config.WithCacheDuration(0),
        ),
    ),
)Note: The default directory for cache object storage is “~/.censeye/cache”, but can be changed with the configuration directive “config.WithWorkdir(<path>)”
Example Censeye CLI utility
We’ve also wrapped up all of this functionality into a single example utility that works similarly to the old Censeye CLI, except now it’s significantly faster and takes full advantage of the latest features available in the Censys Platform. Think of it as an advanced example wrapper around the Censys Threat Hunting Platform.
% censeye-ng -h
Usage:
  censeye-ng [flags]
  censeye-ng [command]

Available Commands:
  compile     Compile Censeye queries from a file
  completion  Generate the autocompletion script for the specified shell
  help        Help about any command

Flags:
  -a, --at string                 Fetch host data from a specific date (e.g., '2023-10-01 12:00:00')
      --at-time string            alias for --at
  -C, --cache-duration duration   Duration to keep the cache (default: 23h) (default 168h0m0s)
  -c, --config string             Path to the configuration file
  -d, --depth int                 Depth of the scan (default: 0)
  -h, --help                      help for censeye-ng
  -L, --log-level string          Log level (debug, info*, warn, error, fatal, panic)
      --no-color                  Disable colored output
      --no-link                   Disable hyperlinks in output
  -O, --org string                Organization ID
  -o, --output string             Output format (pretty / json) (default "pretty")
  -p, --pivot-threshold int       maximum number of hosts for a search term that will trigger a pivot (default -1)
      --pivotable strings         fields that should be considered for pivoting when depth > 1 (can be specified multiple times)
      --showconf                  Show the configuration file in YAML format before running the command
      --workers int               Number of parallel workers (for auto-pivot feature only) (default 3)
Reporting
General Reporting
By default, the example censeye-ng reads hosts from stdin. For each host, it generates a structured report. If you provide a single IP address as a command-line argument, it will only create a report for that host.
In the example below, we query a single IP 122.6.3.201 (the same one we’ve used in the previous examples):

Even for a relatively small host, the report contains a lot of information. Let’s break it down section by section.
Report Header
At the top of every report, you’ll find general metadata about the host in question:
122.6.3.201 labels:[LOGIN_PAGE] threats:[NPS] (depth: 0) (via: -- )- Host: The IP address being analyzed, in this case 122.6.3.201. If your terminal supports clickable links, this will be a hyperlink to the host’s current state in Censys.
- Labels / Threats: These are tags about the host found in Censys. In this case, the host is labeled with LOGIN_PAGE and associated with a known threat NPS.
- Depth: This value represents how deep you are in the recursive pivot process. A depth of 0 means this is the root (the initial host).
- Via: This field shows the CenQL search query that led to this host being included in the report. Since this is the only host, it shows that no search was used to discover it.
Report Body
In the following section, the report walks through each CenQL query that was found, and the number of other hosts on the Internet that matched it:

- First column: a clickable hyperlink that opens the corresponding search on Censys using the query in that row.
- Second column: The number of hosts that matched this specific query
- Third column: The CenQL query key
- Fourth column: The CenQL query value
Note: Rows shown in bold indicate queries that matched more than one host but fewer than the “–pivot-threshold” (default: 50). These are considered “interesting” and would be used for recursive pivoting (if “–depth” is greater than zero)
Report Summary
At the end of the report, you’ll see a summary section like this:

This last section of the host report summarizes any queries from the current report that may be worth pivoting on. Each entry is clickable in supported terminals and links to a Censys search using that specific field/value. In this example, the report identified a single body_hash_sha256 that appeared on only 27 hosts.
Note that these reports can also be generated using the example API in your code with the following functions:
// NewReporter creates a new reporting context
func censeye.NewReporter(w io.Writer) *censeye.Reporter
// Tables displays a slice of reports as multiple tables
func (r *Reporter) Tables(reports []*Report)
Auto-pivoting
So, let’s continue looking at the host here (“122[.]6.3.201“), but this time we’ll allow the tool to automatically pivot into any field it marked as “interesting”. In this case, that’s going to end up being the body_hash_sha256 value that appeared on 27 other hosts.
To do this, we pass the “–depth 1” argument:
% censeye-ng 122.6.3.201 --depth 1This tells the tool to recursively follow any tagged queries found at depth 0, which results in 27 new reports, one for each host that shares the same hash. But, each report now includes some additional metadata in the header section:
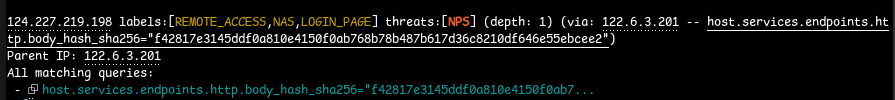
Here, we see a report for the IP 124[.]227.219.198, which was discovered by pivoting from our original input host (122[.]6.3.201) using the shared body_hash_sha256 value…
The Via field shows the specific query that led us to the current host; in this case, the body_hash_sha256 value from the parent. Below that, in the “All matching queries” section, you’ll see that same query listed again; however, if there were multiple matching conditions that connected this host to the parent, they would also appear in this list.
Towards the bottom of the report, we get two very valuable sections: an aggregated list of interesting pivots and the pivot tree.
The interesting pivots section summarizes all CenQL queries that were flagged as promising candidates for pivoting, gathered from every host processed during the run. Each row contains the number of other hosts that match the query, and a hyperlink to the search query in Censys.

Note that this same data can be done via the example API by using the censeye.Reporter functions:
// Pivots generates a list of "Interesting pivots"
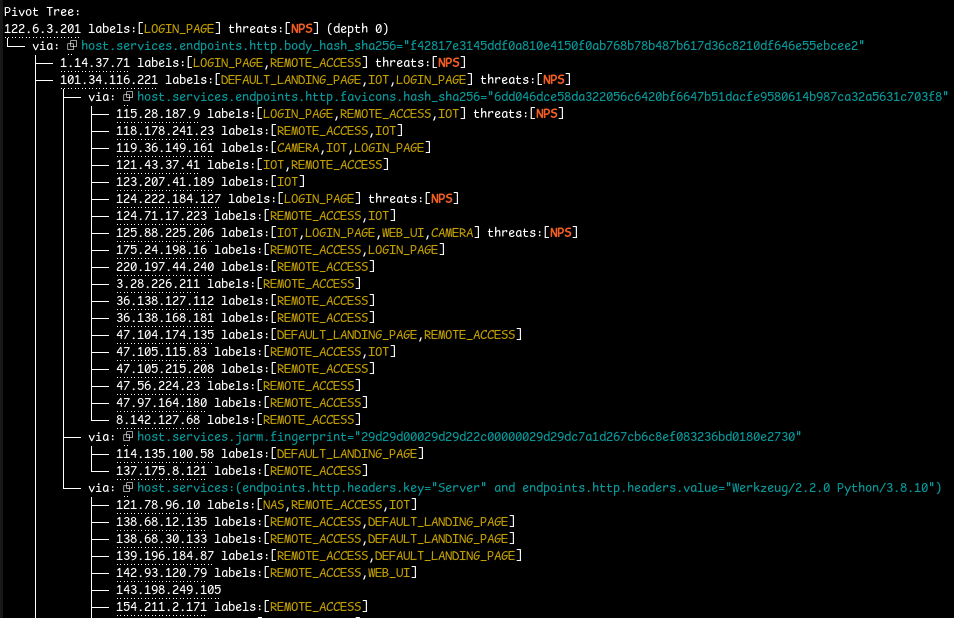
func (r *Reporter) Pivots(reps []*Report)The pivot tree is one of our favorite views, as it graphically shows what hosts the tool found, and how it found them, along with some metadata about each:

Each branch in the pivot tree is either a host or a CenQL query. In the example above, we can see that the process started with the host 122[.]6.3.201, and from there, using the CenQL statement host.services.endpoints.http.body_hash_sha256=”f42817e…”, the tool discovered several other hosts that shared that exact attribute.
Note: The Censeye API includes a helper function for generating a pivot tree for a set of reports: “censeye.CreatePivotTree(<reports>)” which can also be marshaled as a JSON object.
You could, technically, keep increasing the depth to explore more layers of (potentially) related infrastructure. However, in practice, we’ve found that beyond a depth of two, the results tend to become less relevant. The further you get from the original host, the weaker the connection usually is. Also, the number of search terms and matching IPs can grow quite fast at each level, which can lead to an exponential increase in both API usage and noise. But, for funsies, here is a snipped screenshot of our original host at a depth of two:
If you have the query credits to spare, it’s fun to watch it find all the things at higher depths. But it might not be all that useful in all cases. It’s best to take an iterative approach to depth searches: if you see an interesting pivot at a depth of two, don’t immediately increase the depth to three; instead, focus on the individual hosts with the pivot in question.
Note: This exact pivot tree can be generated with the example API using the censeye.Reporter functions:
// PivotTree generates an ascii pivot tree from a slice of reports
func (r *Reporter) PivotTree(reports []*Report)
// CreatePivotTree generates a (raw) marshalable pivot tree from a slice of reports
func (r *Reporter) CreatePivotTree(reports []*Report) []*PivotNode
Hunting with Censys
So far, we’ve walked through how to use the Censys value-counts API to generate bulk reports from host field data and how the example Censeye API and CLI simplify that entire process. Now let’s shift gears and look at a real-world use case.

Imagine you’ve just identified a Cobalt Strike C2 server and want to quickly understand if there are others like it on the Internet. For this example, we’ll use the host 43.133.41[.]106 (screenshot above), which is running a single Cobalt Strike server alongside an exposed RDP service inside of a Tencent ASN located in Singapore. This gives us a perfect opportunity to run the process against a live, known-malicious host and use the results to explore potentially related infrastructure.
We start by running the censeye-ng command on the host in question:
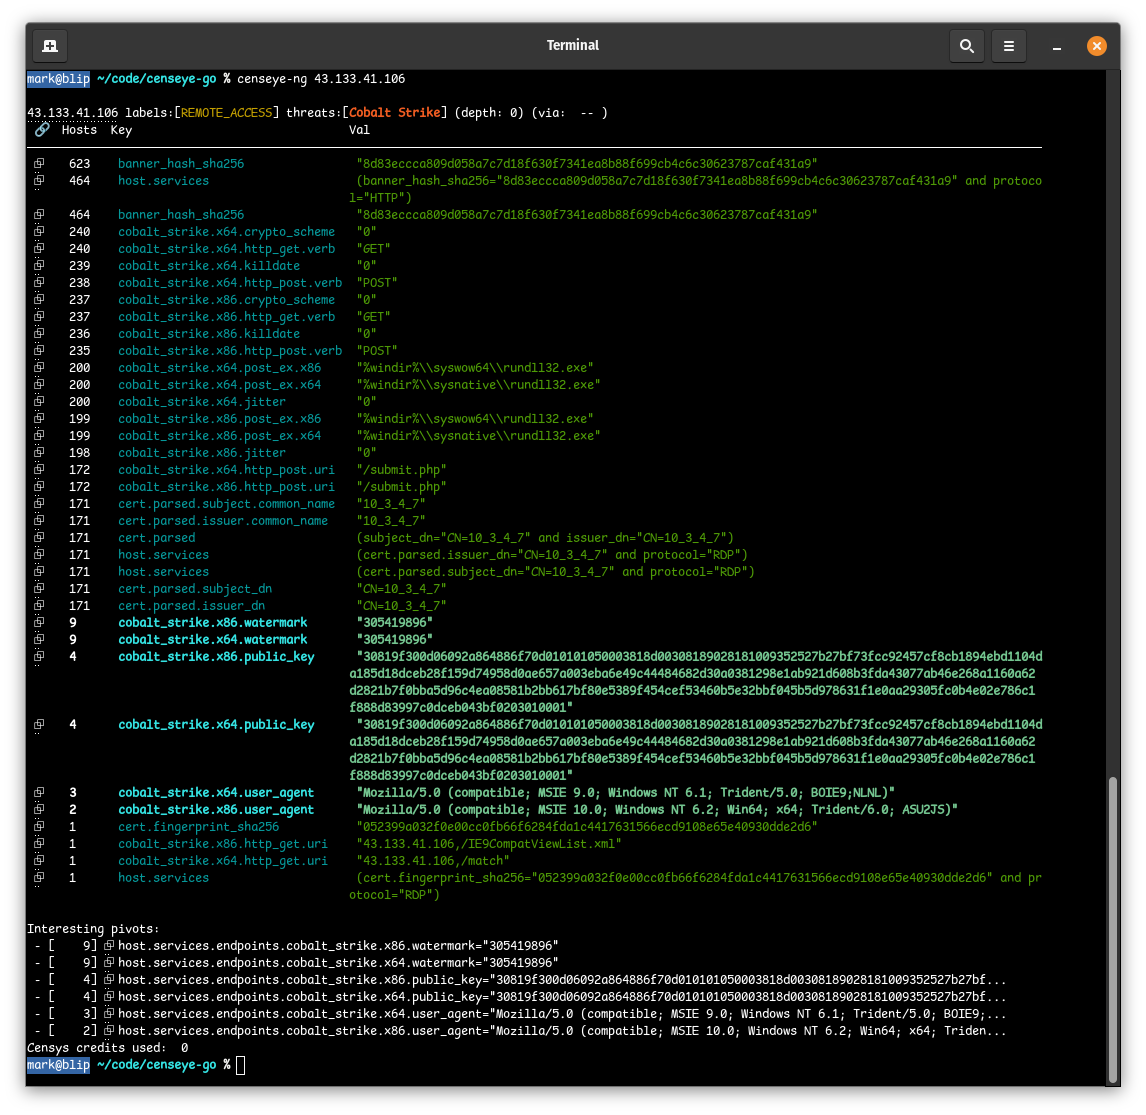
Right away, we can see six fields that stand out. Since Censys was able to extract the beacon configuration from this CS server, Censeye used those fields to identify other hosts on the Internet with identical values. In other words, we’re able to pivot directly from C2 configurations to uncover potentially related hosts.
- The watermark, in Cobalt Strike, is a numeric identifier embedded into the beacon that is tied to a specific license or customer. In this case, the same watermark is seen on eight other hosts, a good indication of related infrastructure.
- During the beacon handshake, the Cobalt Strike server presents a public_key which is used to establish encrypted comms. This key is usually unique to a given deployment, and if multiple hosts share the same public key, the same operator likely controls them.
- Note that this is not the certificate you might see on a service.
- The user_agent is part of the C2 profile used by the beacon to blend in with regular traffic. While C2 profiles can be reused and publicly shared, a unique or unusual user-agent that doesn’t match known public profiles can be a strong indication that the same actors are operating it. In this specific case, we see three hosts with the x64 user-agent, and 2 with the x86 version.
This host is already shaping up to be a strong candidate for a depth search, so we re-run censeye, this time with the “–depth 1″ flag to specifically explore the pivot tree:

As we can see above, all of the pivots led to other Cobalt Strike servers (since we’re pivoting from Cobalt Strike attributes), but the labels here also provide value.
In this case, one host in particular stood out: 47[.]102.209.177, which was discovered via the x86 watermark from the parent host 43[.]133.41.106. What caught our attention was the OPEN_DIRECTORY label, which tells us that this host (while running a Cobalt Strike server) is also running an open HTTP directory that we can browse.
We can get a preview of those files in Censys by navigating to that host on port 7078:

All three of these files look suspicious at first glance, so we jumped on a VPN and downloaded them to take a closer look by running them all through VirusTotal:
% sha256sum toolsd.exe cs.bin hack.jpeg
6c4cd115a00b17b9d177252e120d413589709322ecc2bdb447edd2942f3a2673  toolsd.exe
10b0319f29590ebe8bdb4e9811799f91969ef7e6740dc81983dee00dc803e736  cs.bin
2761793382af1b268576001ca7c51df955275478d77f985a5736f3b9260bcdc0 hack.jpegUnfortunately, not much came back:
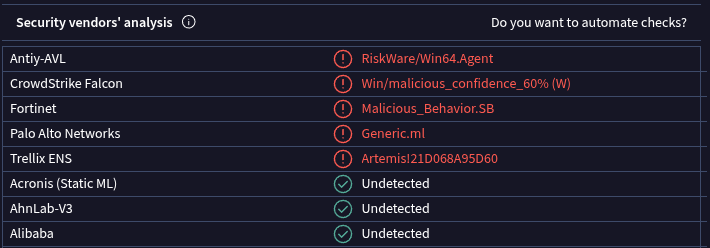
- toolsd.exe (VT) was flagged by only five vendors, with no definitive classification
- cs.bin (VT) has a community score of zero
- hack.jpeg (VT) also has a community score of zero
Running the tool ent on the file “cs.bin” shows a very high entropy score, meaning it’s most likely encrypted or packed in some way:
% ent cs.bin
Entropy = 7.759017 bits per byte.
However, the file hack.jpeg seems to be a completely legitimate JPEG file with no other auxiliary data when viewed with binwalk:
% binwalk hack.jpeg
DECIMAL       HEXADECIMAL     DESCRIPTION
--------------------------------------------------------------------------------
0             0x0             JPEG image data, JFIF standard 1.01
While VirusTotal wasn’t very helpful here, a simple strings analysis of toolsd.exe revealed a few (pretty obvious, figlet-generated) clues:

A quick GitHub search for the phrase “Color Picked By Icy Water” led us to a project called InjectTools (uploaded to GitHub 11 months ago), which seems to be a utility designed to encrypt Cobalt Strike payloads using RC4 to evade EDR/AV detection.
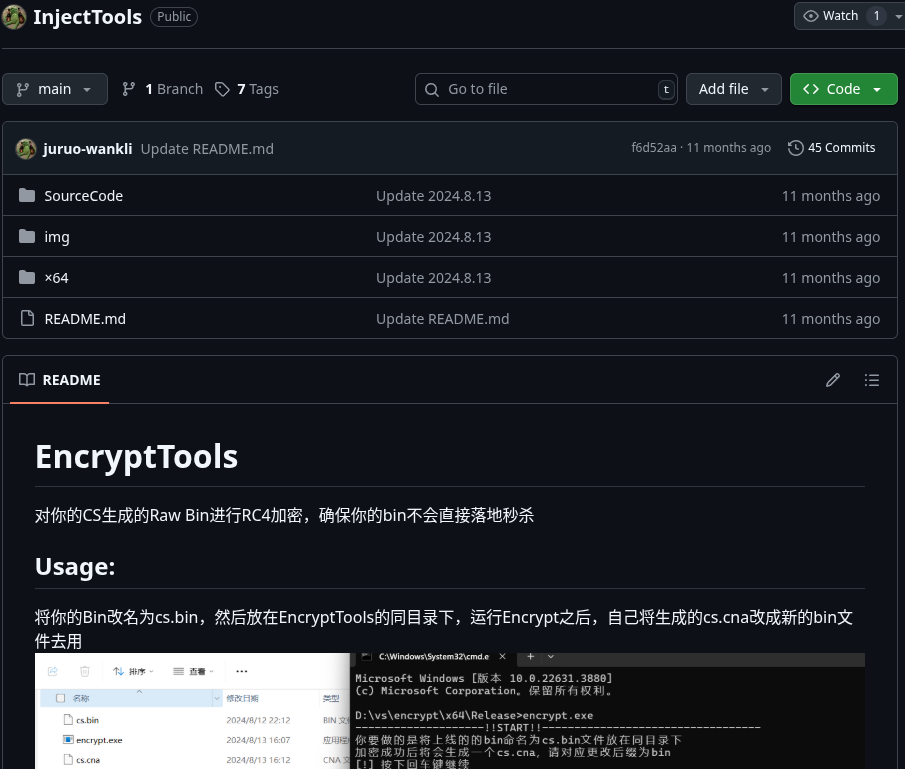
So, based on this evidence, toolsd.exe is likely part of a custom toolkit, and cs.bin is most likely the encrypted Cobalt Strike payload.
Another host in the pivot tree that stood out was 154[.]222.31.14, which shares the same Cobalt Strike watermark as our original target. This host is running an Asset Reconnaissance Lighthouse instance on port 5003 and a CS server on port 8808, which means it’s probably being used to find and scan for potentially vulnerable targets.
We also discovered four additional hosts that share not just the same watermark, but also the same public_key (note the “All matching queries” section in the screenshot below), which increases the likelihood that this is shared infrastructure:
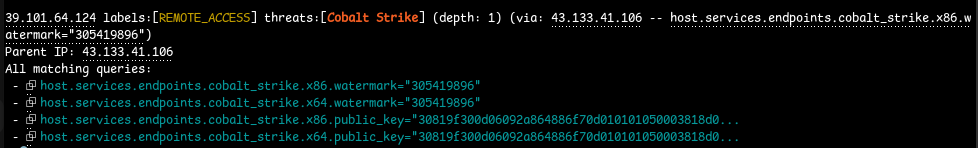
- 43.133.41[.]106 – Singapore
- 39.101.64[.]124 – China
- 49.235.64[.]155 – China
- 101.43.2[.]116 – China
One of those four hosts, 49[.]235.64.155, included an additional report that caught our attention. On port 16601, there is an HTTP service with a very unique JARM fingerprint that matches only 32 other hosts on the Internet. Combining this high port and the fact that it’s a rare JARM fingerprint, we can dig into the JARM-specific connections by issuing the following command:
% censeye-ng 49.235.64.155 --pivotable host.services.jarm.fingerprint --depth 1This tells the utility to look at the one host, but only pivot into the “host.services.jarm.fingerprint” field when doing a depth search of 1.
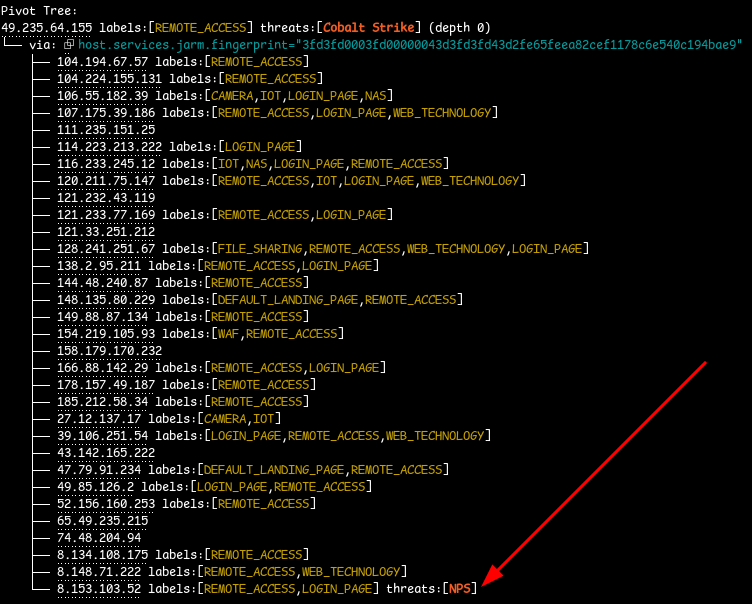
We can see (screenshot below) that all the services sharing this JARM fingerprint are running a tool called Lucky666[.]cn, identified via their TLS certificate. Lucky666 is a Chinese-developed platform for exposing and managing internal services using port-forwarding and reverse proxying.
The application itself seems to be deployed on over 5,000 hosts. But, in this case, the JARM fingerprint may reflect the service behind the proxy (not the proxy itself) depending on whether Lucky666 is handling the TLS handshake directly. Since thousands of other Lucky666 instances do not share this specific JARM, this fingerprint likely comes from a specific backend service exposed through the proxy.

Another thing to note is that none of the hosts sharing this JARM appeared particularly malicious, except for one: 8.153.103[.]52, which was running NPS, an intranet penetration proxy service. Could this be one of the tools the threat actor is using to gain access to internal networks? Hard to say from scan data alone, but it’s something worth digging into.
In less than ten minutes, using Censeye (and by extension, the new value-counts API), we were able to identify at least eight other hosts that are very likely related to our original Cobalt Strike C2 server. On top of that, we uncovered some of the tooling the threat actors are using thanks to an exposed open directory and software labels on some of the pivoted hosts. We were able to establish a strong connection between our initial host and four other hosts using the Cobalt Strike beacon configuration, and identified some services that require closer examination.
Historical Analysis, Too!
With the example Censeye API, you can even use historical host data to identify currently online hosts that exhibit similar characteristics. For instance, by using an IP address featured in a Sekoia.io blog about PolarEdge (a host which was used to distribute payloads to compromised devices), we can analyze it as if the date is still October 18th, 2024, by adding the “–at-time 2024-10-18” flag:

The highlighted rows in the report indicate which field/value pairs from that historical host are still present in active infrastructure today.
Installation
The example Censeye API is written in Go, which can be used in projects by running the following:
% go get github.com/censys-research/censeye-ngOr, if you would prefer just to use the example CLI utility:
% go install github.com/censys-research/censeye-ng@latestThe project assumes that you are using the Censys Threat Hunting Module on the new Censys Platform and have API access enabled for your account. For more on setting up API access, refer to the documentation. Once you have an API token and an organization ID, simply set the following two environment variables:
export CENSYS_PLATFORM_ORGID="<your_org_id>"
export CENSYS_PLATFORM_TOKEN="<your_api_token>"
Try the Threat Hunting Module
Schedule a demo or request a trial of the Threat Hunting Module today by reaching out to support@censys.com.