

Introduction
A previously unexplored concept of threat infrastructure is their time to live, or TTL. In an ever changing world, understanding how quickly threat infrastructure remains online, disappears, or moves is incredibly useful for defenders and researchers. Given the unique perspective of Censys, which is continuously scanning entities on the Internet, we are able with high confidence to examine TTLs, or the lifespans, of services and understand the repercussions of varying TTLs for defenders and researchers.
Given the overall distribution of C2 services found in our introduction to the State of the Internet Report, we focus on Cobalt Strike and Viper for the remainder of our analysis.
Lifespans by Network Availability
TTL can traditionally be viewed from the network sense: how long is a specific service online before it disappears? We examine the Censys April daily Universal Internet snapshots to answer this question, and calculate time to live in the order of days. The results for Cobalt Strike and Viper services can be found in Table 1.
Cobalt Strike and Viper services act quite differently. First, TeamServer, the part controlled by a threat actor, services are much shorter lived, with TTLs on average/median of 11.2/5.0 days, whereas Viper services exhibit TTLs of 17.4/18.5 days. We hypothesize that this is because Cobalt Strike is more well known and prevalent, thus showing a much wider range of behaviors than Viper services.
| Average | Median | 25th percentile | 75th percentile | Max | |
| Cobalt Strike | 11.2 | 5.0 | 3.0 | 19.0 | 30 |
| Viper | 17.4 | 18.5 | 4.0 | 30.0 | 30.0 |
Table 1: Cobalt Strike and Viper TTLs in days according to service/network availability
This overarching view of the two C2 families exemplifies the huge variability in even these basic metrics. We next dive deeper and examine the most popular ports for Cobalt Strike and Viper services. Since there is a much longer tail for cobalt strike than viper services, we simply show the five most prevalent ports and their mean/median TTL in days, found in Table 2 and 3.
Even within a family, there can be a variance of difference. With popular Cobalt Strike ports, this variance is far smaller, ranging from an average of 6.3 days to 11.8 days. However, for Viper we see a much larger range, from an average of 6.8 days to 30 days (the duration of our data analysis period). This points to the need to not only investigate specific families and their behaviors, but also specific sub-areas within those families.
| Port | Mean | Median | Percentage of Total |
| 443 | 11.7 | 6.0 | 23.8 |
| 80 | 9.6 | 4.0 | 21.7 |
| 50050 | 6.3 | 4.0 | 9.2 |
| 8443 | 11.8 | 8.0 | 3.9 |
| 8080 | 9.5 | 4.0 | 3.7 |
Table 2: Cobalt Strike most populous port TTLs in days according to service/network availability
| Port | Mean | Median | Percentage of Total |
| 60000 | 6.8 | 5.0 | 46.6 |
| 80 | 29.8 | 30.0 | 45.4 |
| 443 | 8.2 | 1.0 | 6.9 |
| 4040 | 30.0 | 30.0 | 0.2 |
| 8096 | 7.0 | 7.0 | 0.2 |
Table 3: Viper most populous port TTLs in days according to service/network availability
What’s Content Got to Do With It?
Thus far we have examined TTLs in the context of network availability: when was the service online, and when did it go down? However, there is more to a service than just its network availability, as a service often has rich forms of content associated with it. We examine cobalt strike servers through an examination of observed watermarks for 32-bit copies of Beacon, and analyze their lifespans through a content level perspective.
We begin by examining x86_watermarks in aggregate during the month of April. Watermarks in Cobalt Strike beacons are an embedded value that are believed to correlate to a purchaser’s software license. Common numbers, like 987654321, 66666666, and 391144938 all have over 100 unique hosts with that watermark over the given timeframe, and often are the results of software cracks or intentional tampering, thus are not great indicators of uniqueness. However, we find a large variation in the number of unique IPs per watermark.
| x86_watermark |
| 0 |
| 1 |
| 6 |
| 32 |
| 100000 |
| 666666 |
| 1755231 |
| 305419896 |
| 388888888 |
| 391144938 |
| 426352781 |
| 666666666 |
| 674054486 |
| 678358251 |
| 785920802 |
| 987654321 |
| 1234567890 |
| 1359593325 |
| 1580103824 |
| 1670873463 |
| 1711276032 |
| 1873433027 |
Table 4: We show watermarks observed over our analzyed timeframe
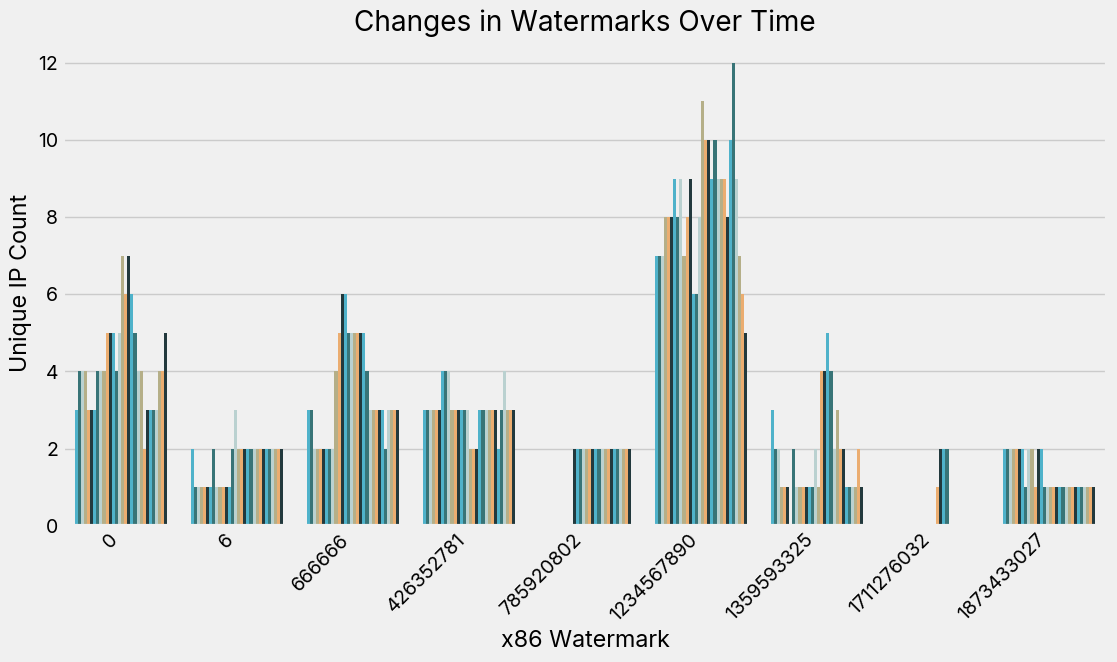
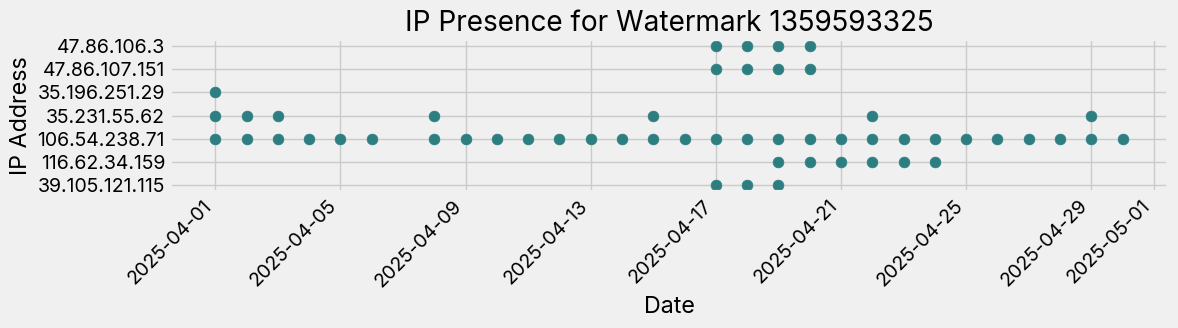
We show in Figure 2 how the number of hosts with a given watermark changes over time (we also filter to watermarks that have more than 1 and less than 20 unique IPs). While some are consistently around, the fluctuation shows that it is feasible to track liveliness based on this content based watermark. Further, Figure 3 shows the difference that comes with examining hosts at the watermark, or content, level. If you look at specific IPs, you can see that while the service may disappear, the watermark actually remains the same.
When we use the watermark as an indicator of liveliness, for these IPs that have an x86_watermark, we find that the average/median TTL for services is 9.5/4.0 days, while the average/median TTL for services based on their watermarks is actually 11.1/6.0 days. The increase is slight, but belays the potential importance of tracking services based on their uptime or content.
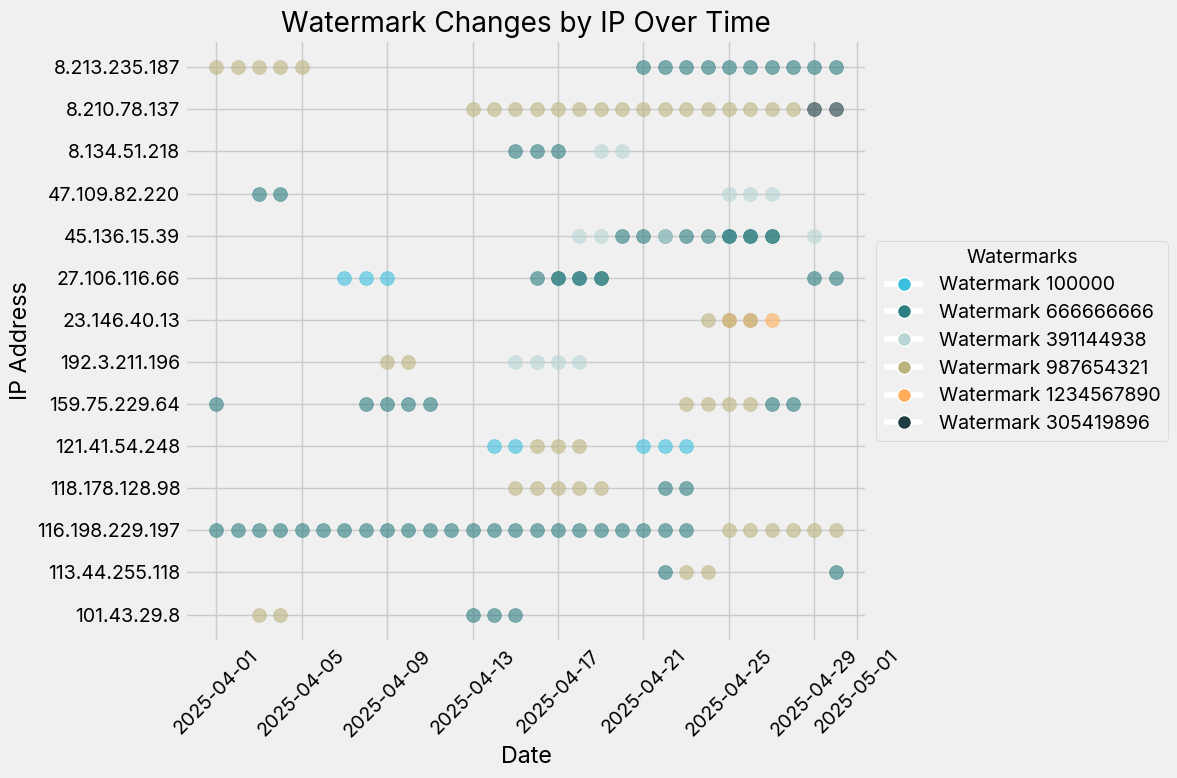
To add to this nuance, we also check how many IPs have more than one watermark. We find 14 IPs (an incredibly small population) that have more than one watermark, and show how the service switches its watermark. In some cases, the switch is within a single day, which would conflat service liveliness with content liveliness. While 14 hosts is an incredibly small subpopulation, this points to some interesting takeaways, namely:
- We cannot always guarantee that service liveliness means the host is the same and
- These hosts exhibit strange, non-conformant behavior that is worth investigating further.
Conclusions
We examine a C2 server’s time to live using two perspectives, network liveliness and content liveliness. We find that Cobalt Strike services are much shorter lived that Viper services, which belays the importance of treating C2 families uniquely. Moreover, we show how liveliness can be defined by the content of the C2 server itself, which can show how a server is changing (or not changing) even in the absence of network presence.
What does this mean for security defenders and researchers? When analyzing C2 families, we need to understand both the base behavior of that family, but how things like the port(s) of question, as well as service vs content liveliness, might affect analysis outcomes. It’s a fraught place on the Internet, and understanding that variation in these behaviors can help the security community produce higher quality analysis.
The 2025 State of the Internet Report continues with Part 5 that digs into Operational Relay Box (ORB) networks targeting residential and small office devices.